Fig. 1.
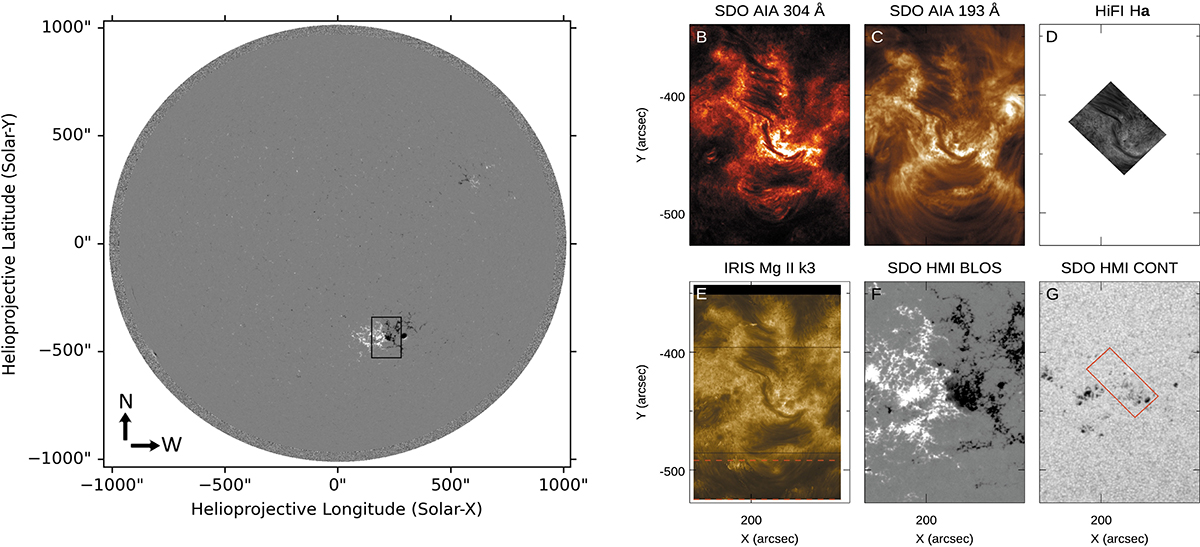
Download original image
Overall view of AR12871. Panel A: Full-disk magnetogram clipped between ±500 G from HMI taken at 10:55 UT on November 10. The black box indicates the FoV shown in the following AIA 304 and 193 Å bands (panels B and C). Panel D: High-spatial resolution HiFI Hα image taken at 10:48 UT on November 10. Panel E: IRIS slit-reconstructed image in the center of the Mg II k3 line acquired between 11:03 UT and 11:52 UT on November 10. Panels F-G: HMI magnetogram clipped between ±500 G and continuum taken at 10:55 UT. The red box in the continuum image indicates the GRIS FoV.
Current usage metrics show cumulative count of Article Views (full-text article views including HTML views, PDF and ePub downloads, according to the available data) and Abstracts Views on Vision4Press platform.
Data correspond to usage on the plateform after 2015. The current usage metrics is available 48-96 hours after online publication and is updated daily on week days.
Initial download of the metrics may take a while.