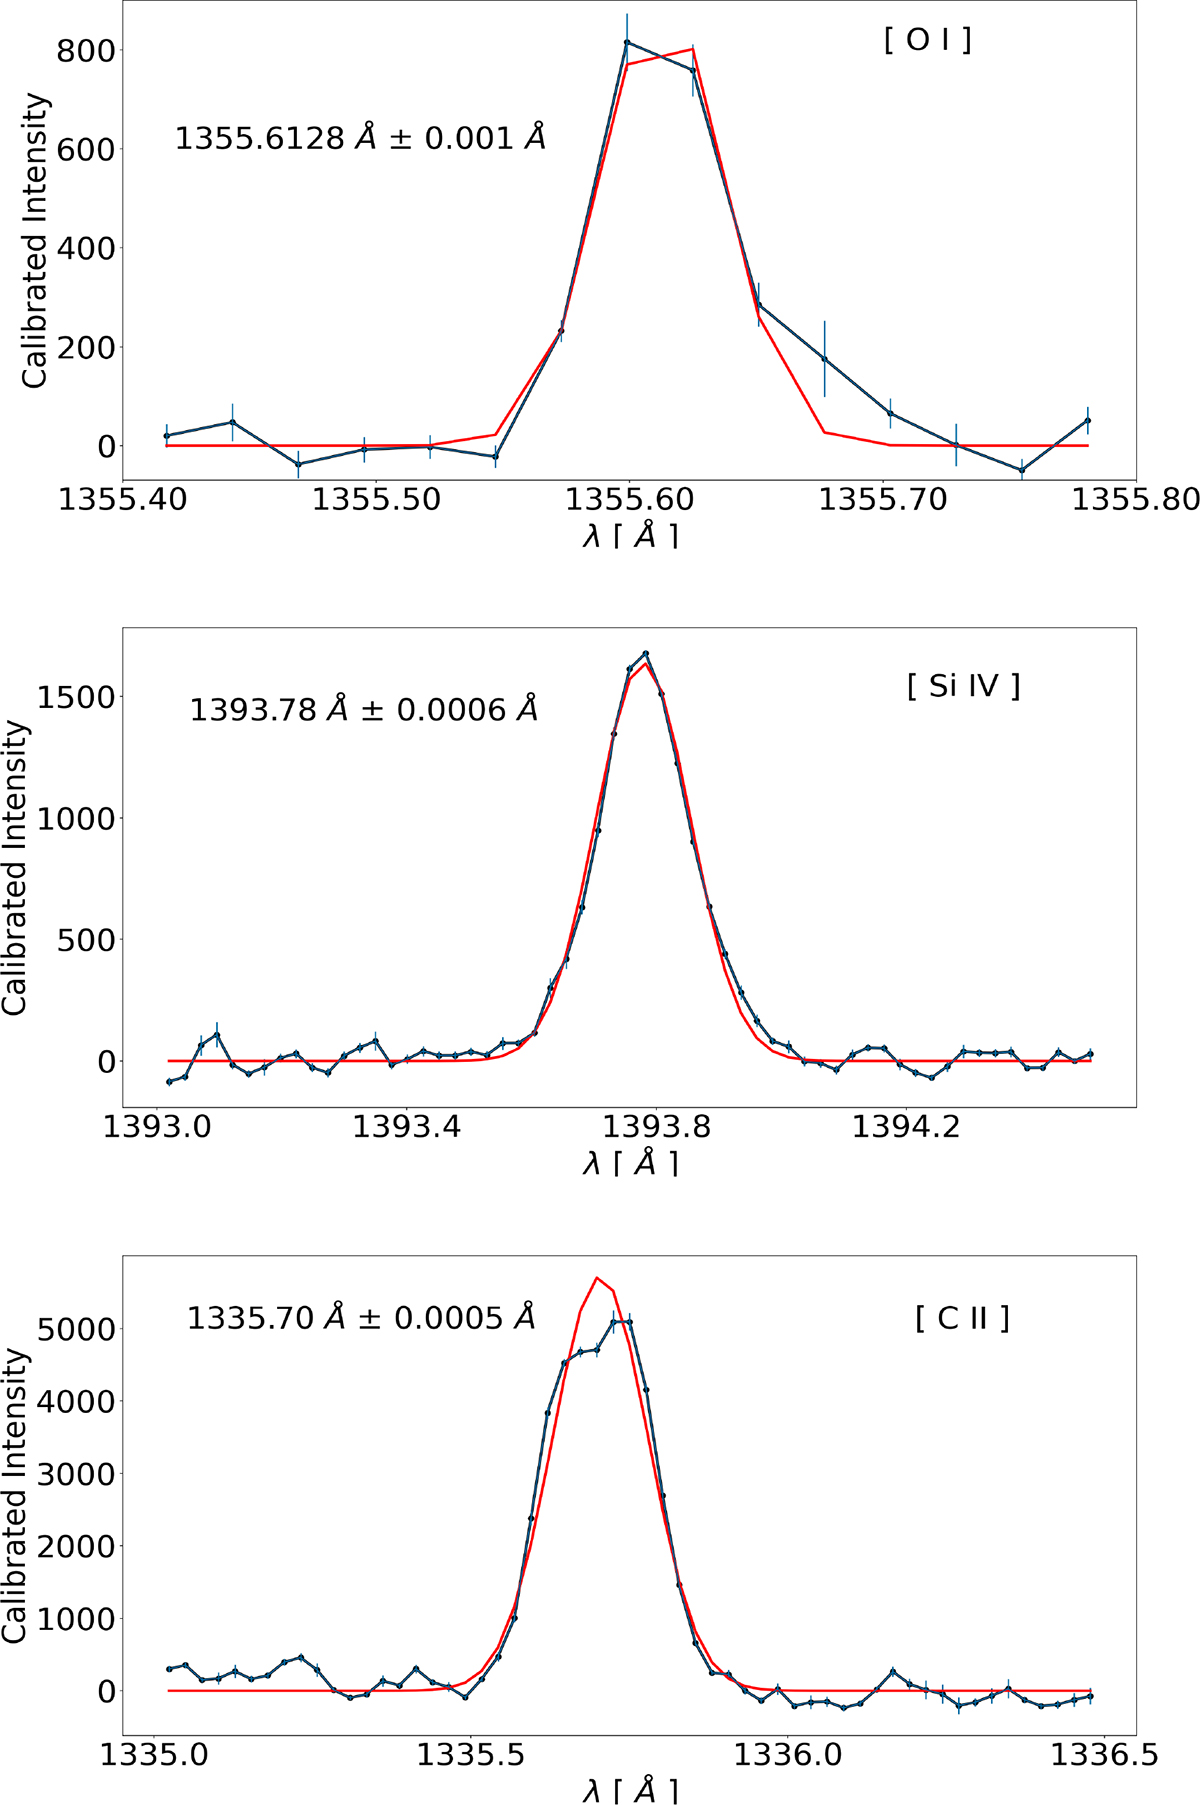
Fig. B.1.
Download original image
From top to bottom: O I 1355.6 Å, Si IV 1393 Å and C II 1336 Å average spectral profiles. The observed spectral lines (black curves) are averaged over the entire QS FoV taken on 12 November 2020. The best fit with a Gaussian is shown in red. Error bars on the black curves represent the standard deviation of the intensity at each wavelength point, computed across all spatial pixels in the QS FoV. Intensities are given in units of [erg cm−2 s−1 sr−1 Angstrom−1].
Current usage metrics show cumulative count of Article Views (full-text article views including HTML views, PDF and ePub downloads, according to the available data) and Abstracts Views on Vision4Press platform.
Data correspond to usage on the plateform after 2015. The current usage metrics is available 48-96 hours after online publication and is updated daily on week days.
Initial download of the metrics may take a while.