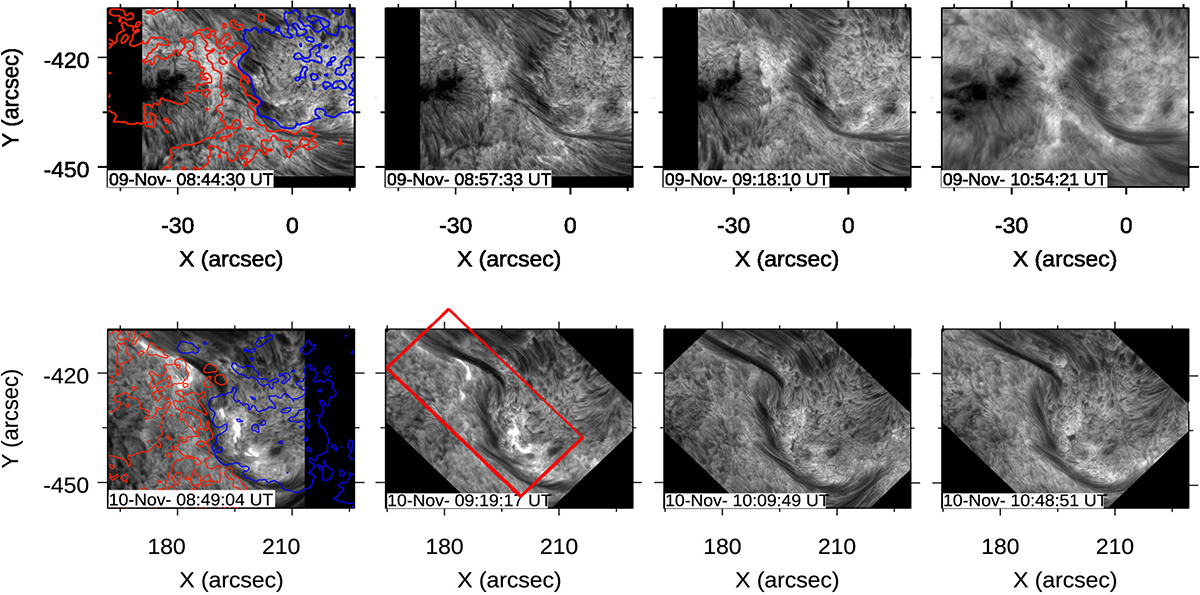
Fig. 2.
Download original image
Restored Hα filtergrams acquired by HiFI instrument at GREGOR telescope showing fine structure of filament at various times on November 9 (top panels) and November 10 (bottom panels). The red and blue contours in the first panels indicate the positive and negative magnetic flux density obtained from SDO/HMI at level equal to ±200 G, respectively. The red box in the second-from-bottom panel represents the GRIS acquired scanned FoV from between 09:17:32 and 09:37:05 UT. Movies of the HiFI data showing the filament in the time interval between 08:44 UT and 11:02 UT (10:49 UT) on November 9 and 10 are available online.
Current usage metrics show cumulative count of Article Views (full-text article views including HTML views, PDF and ePub downloads, according to the available data) and Abstracts Views on Vision4Press platform.
Data correspond to usage on the plateform after 2015. The current usage metrics is available 48-96 hours after online publication and is updated daily on week days.
Initial download of the metrics may take a while.