Fig. 3.
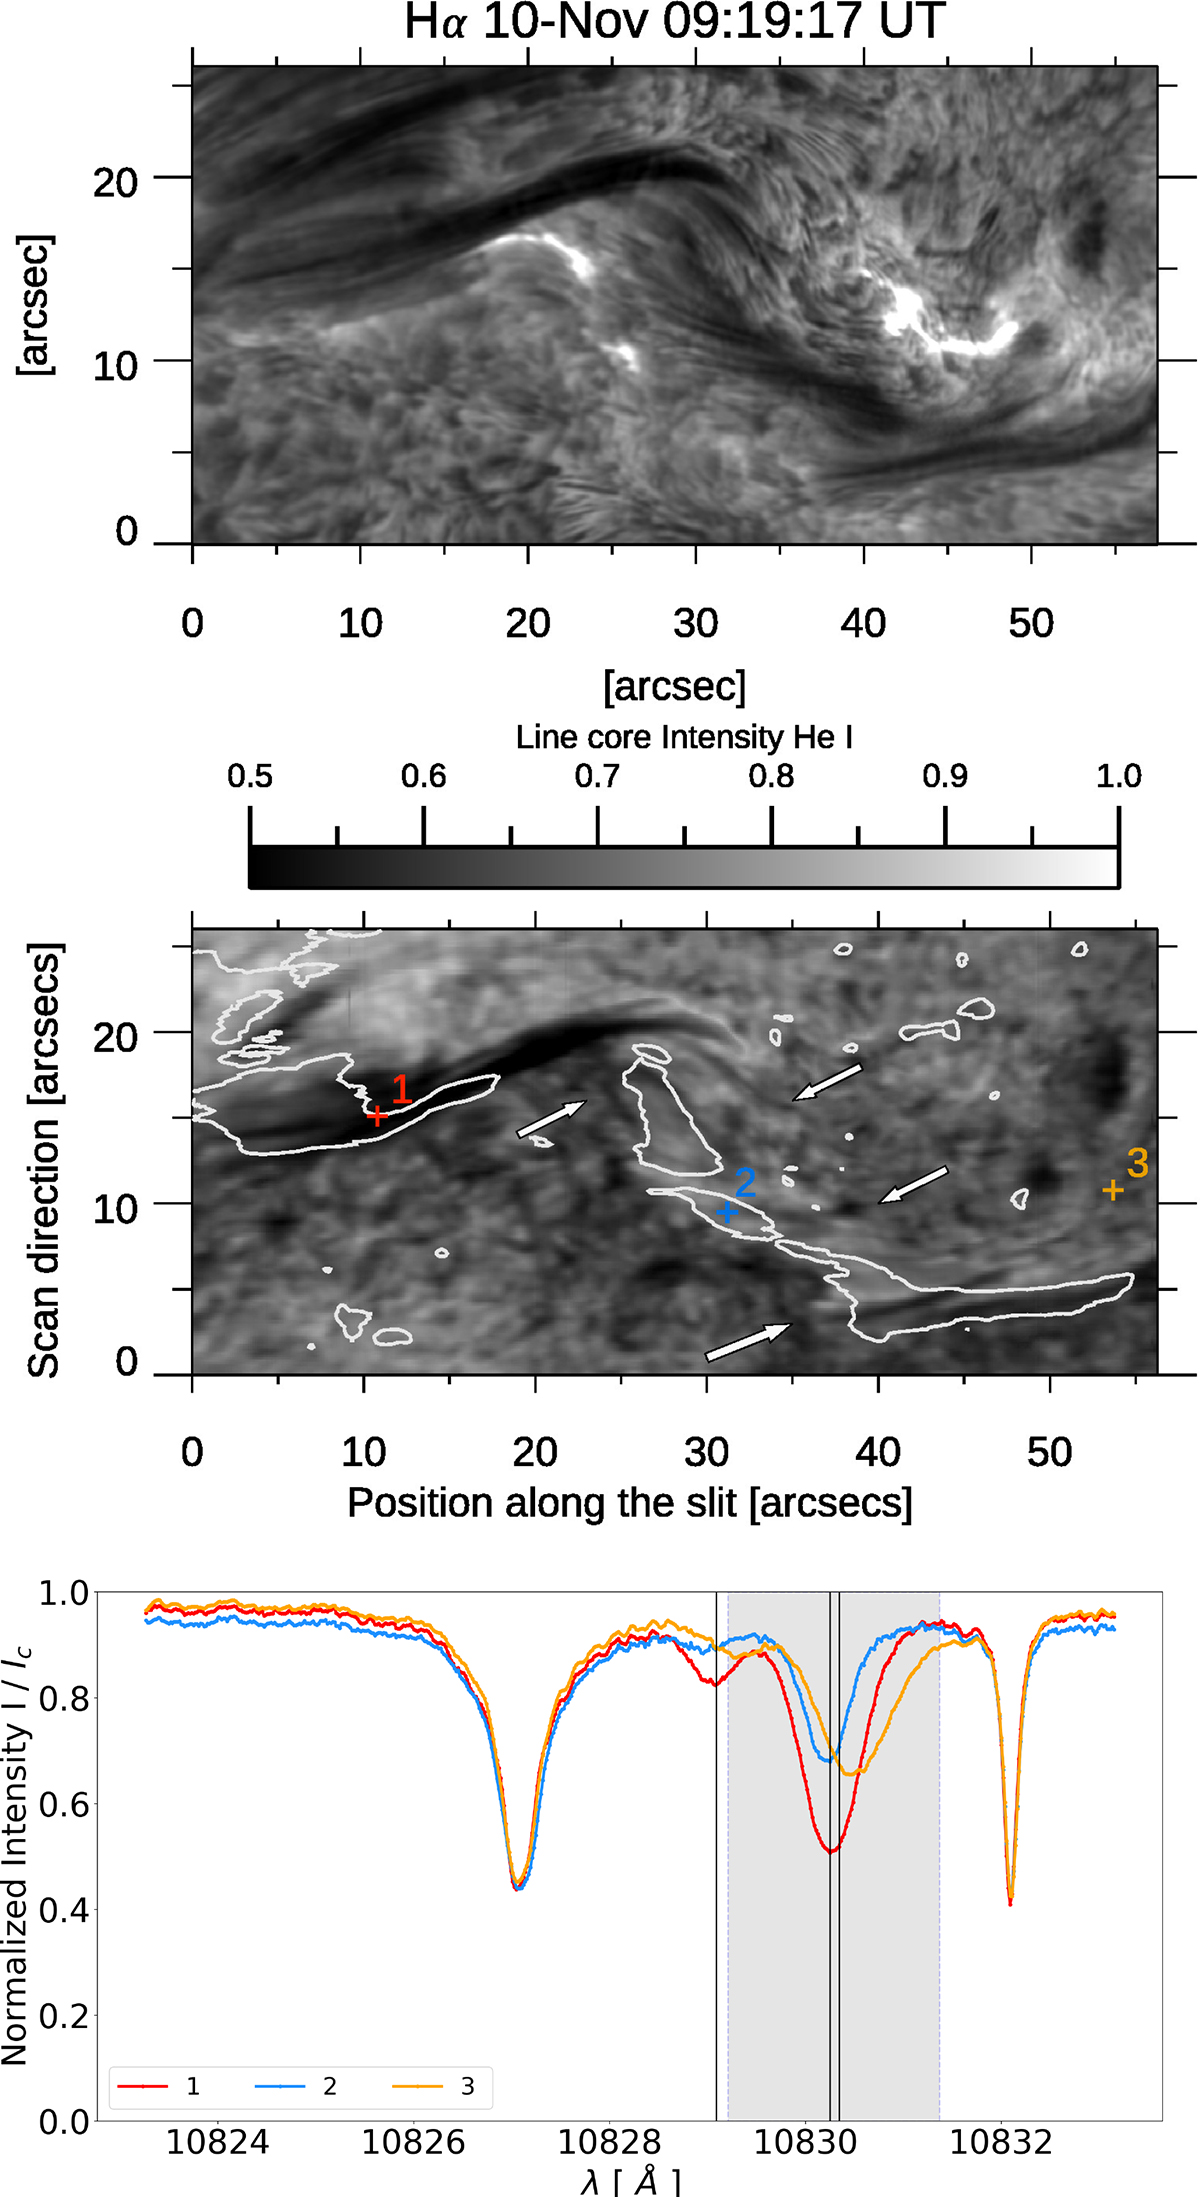
Download original image
Top panel: Zoomed-in view of Hα filtergram for reference. Middle panel: GRIS slit-reconstructed He I line core intensity of the RoI acquired between 09:17:32 and 09:37:05 UT on November 10. Bottom panel: Stokes-I profiles, normalized to continuum intensity, observed at the red, blue, and orange (1, 2, and 3) positions shown in the He I line core map. Arrows point to thin, darker, elongated threads where the optical thickness of the He I line is higher than their own surroundings (Fig. 4). White contours represent a plasma velocity of about −1 km s−1. The shaded area indicates where the He I line core is calculated (see Sect. 3.2 for more details). The vertical lines represent the rest wavelengths for the three He I components as reported in Table 1 of Kuckein et al. (2012).
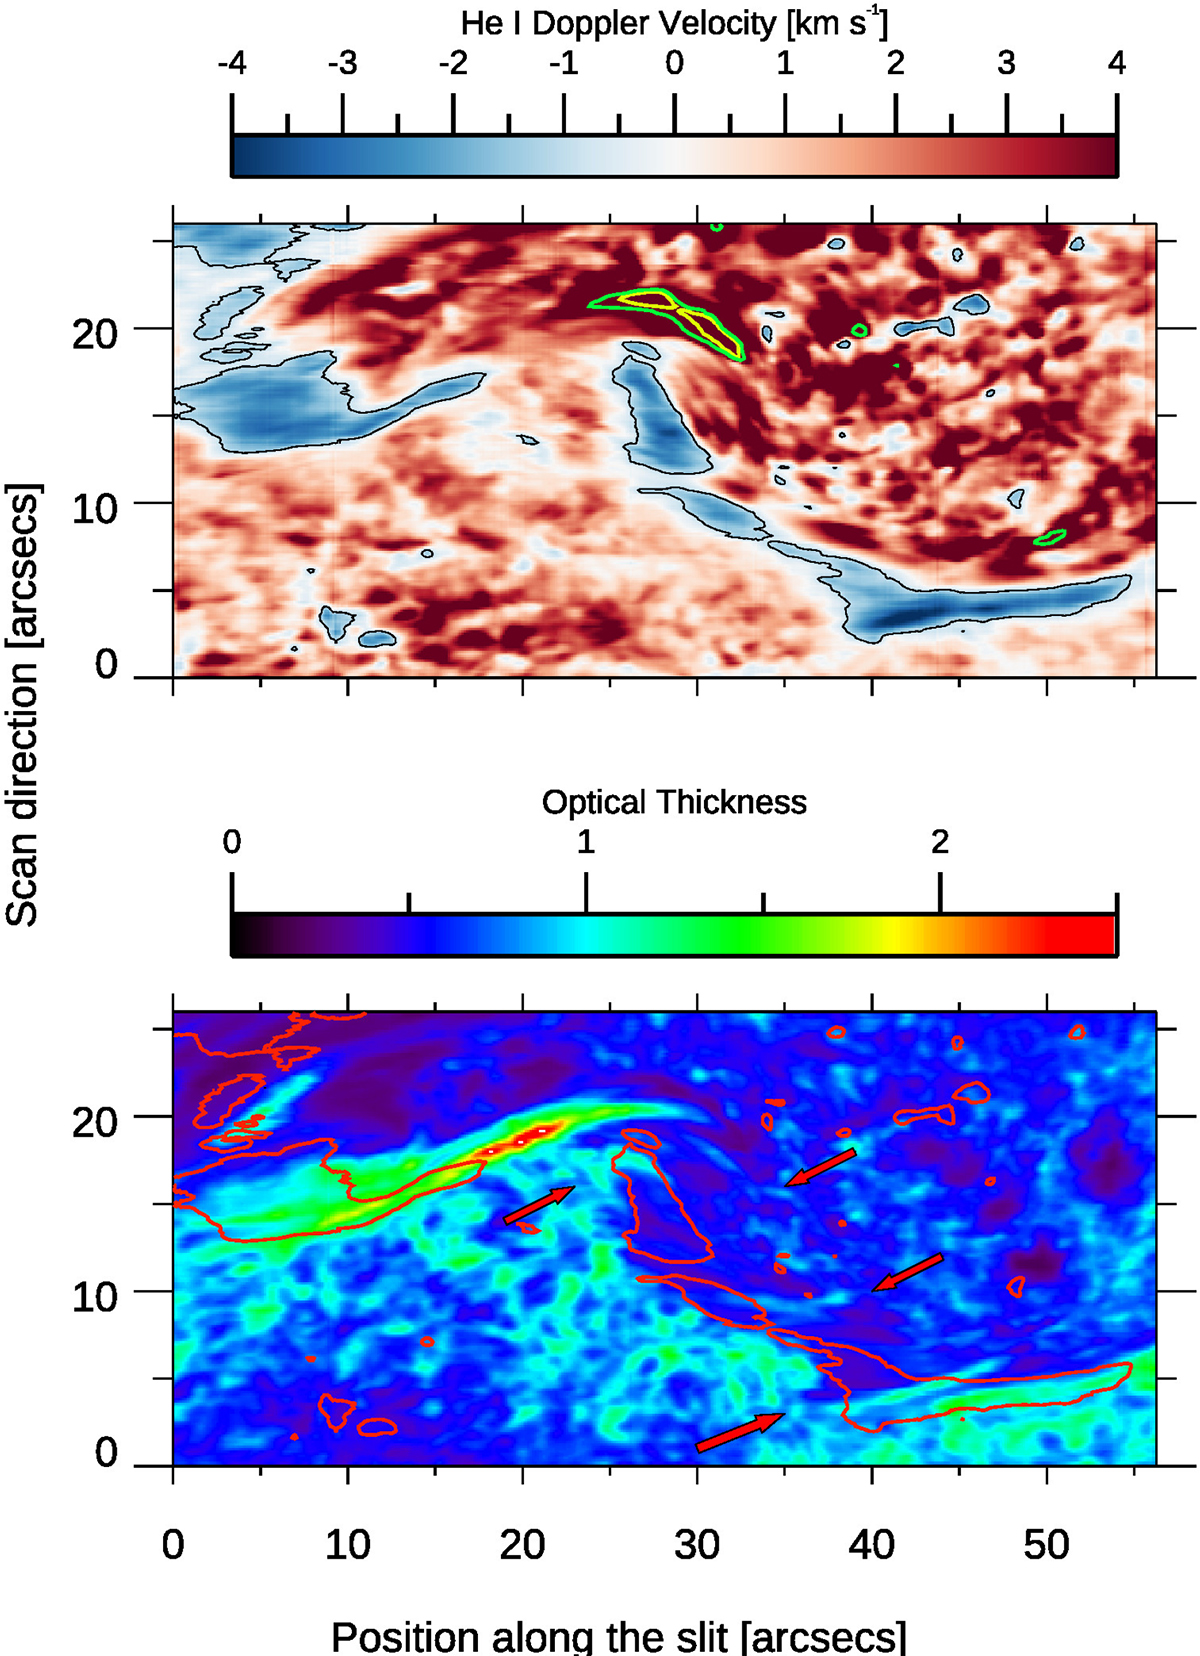
Fig. 4.
He I Doppler velocity and optical thickness of GRIS observation, as calculated using the HAZEL code. Black and red contours represent plasma velocity of −1 km s−1. Green and yellow contours indicate plasma velocities greater than 10 and 15 km s−1.

Current usage metrics show cumulative count of Article Views (full-text article views including HTML views, PDF and ePub downloads, according to the available data) and Abstracts Views on Vision4Press platform.
Data correspond to usage on the plateform after 2015. The current usage metrics is available 48-96 hours after online publication and is updated daily on week days.
Initial download of the metrics may take a while.