Open Access
Fig. 4.
Download original image
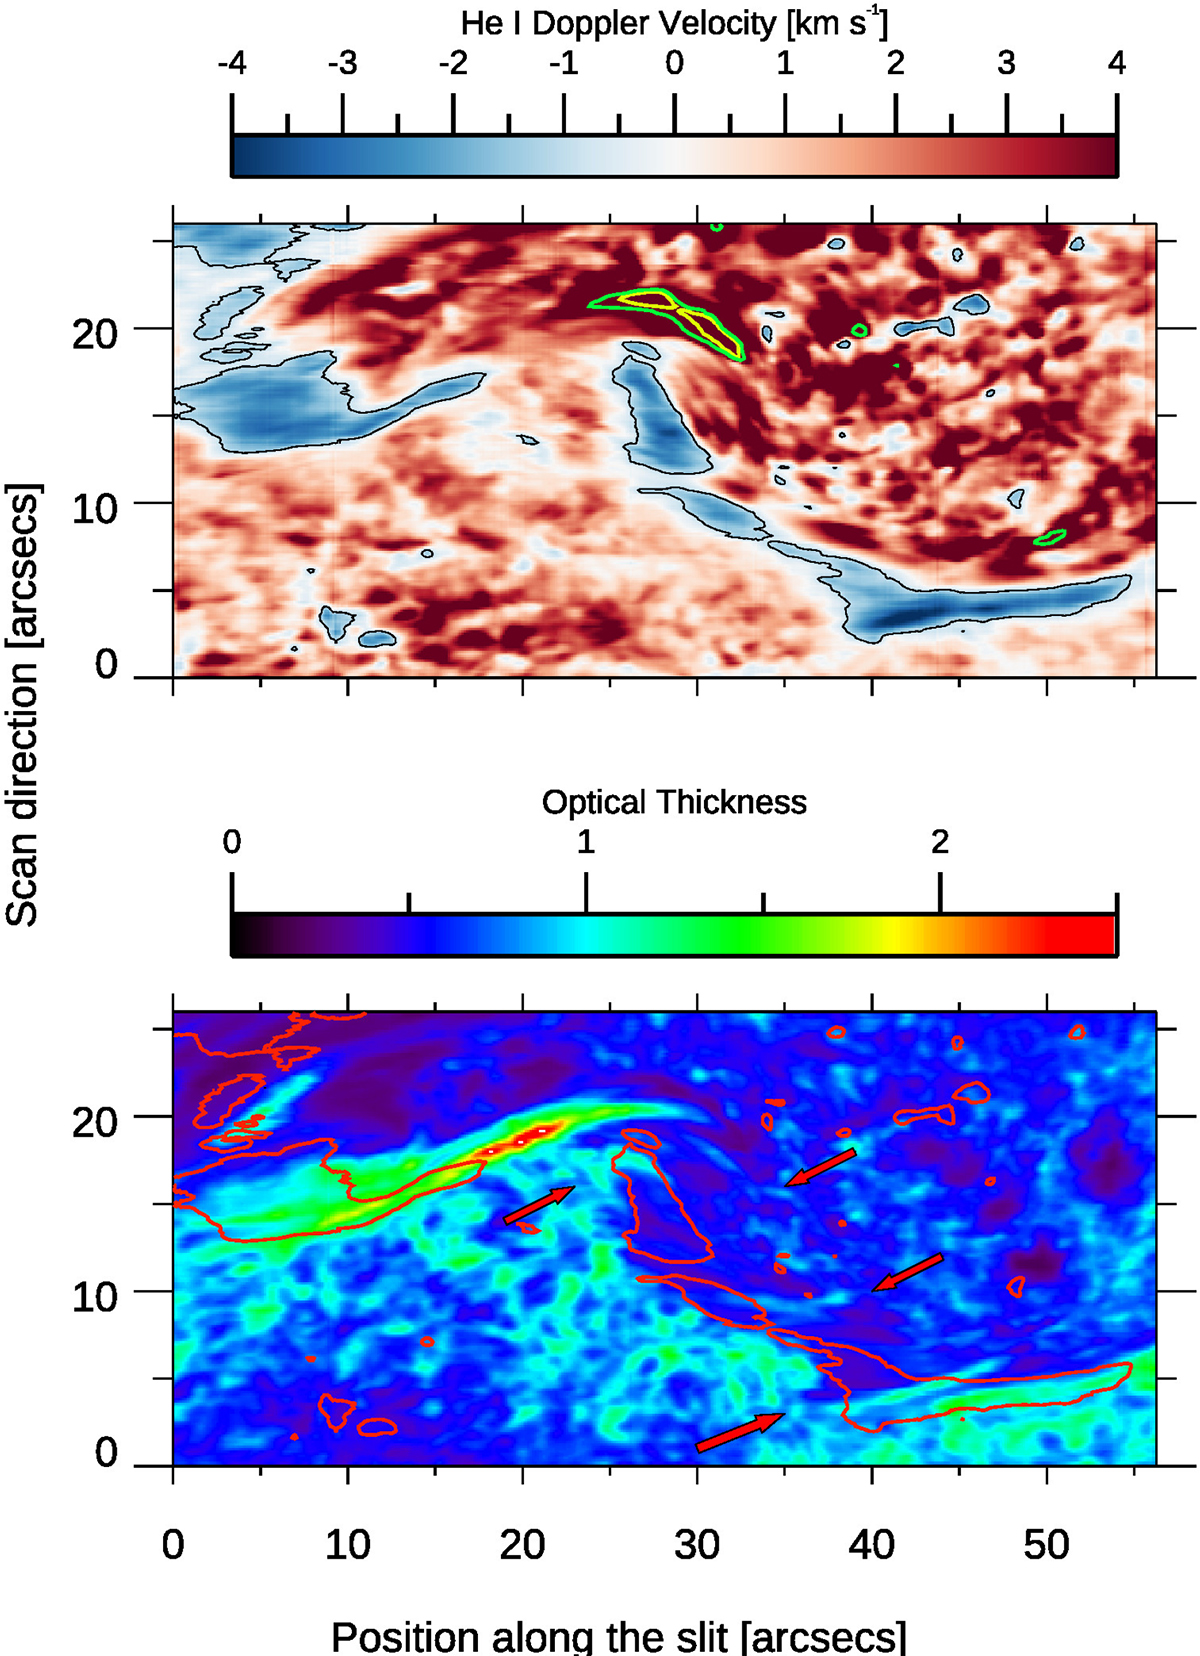
He I Doppler velocity and optical thickness of GRIS observation, as calculated using the HAZEL code. Black and red contours represent plasma velocity of −1 km s−1. Green and yellow contours indicate plasma velocities greater than 10 and 15 km s−1.
Current usage metrics show cumulative count of Article Views (full-text article views including HTML views, PDF and ePub downloads, according to the available data) and Abstracts Views on Vision4Press platform.
Data correspond to usage on the plateform after 2015. The current usage metrics is available 48-96 hours after online publication and is updated daily on week days.
Initial download of the metrics may take a while.