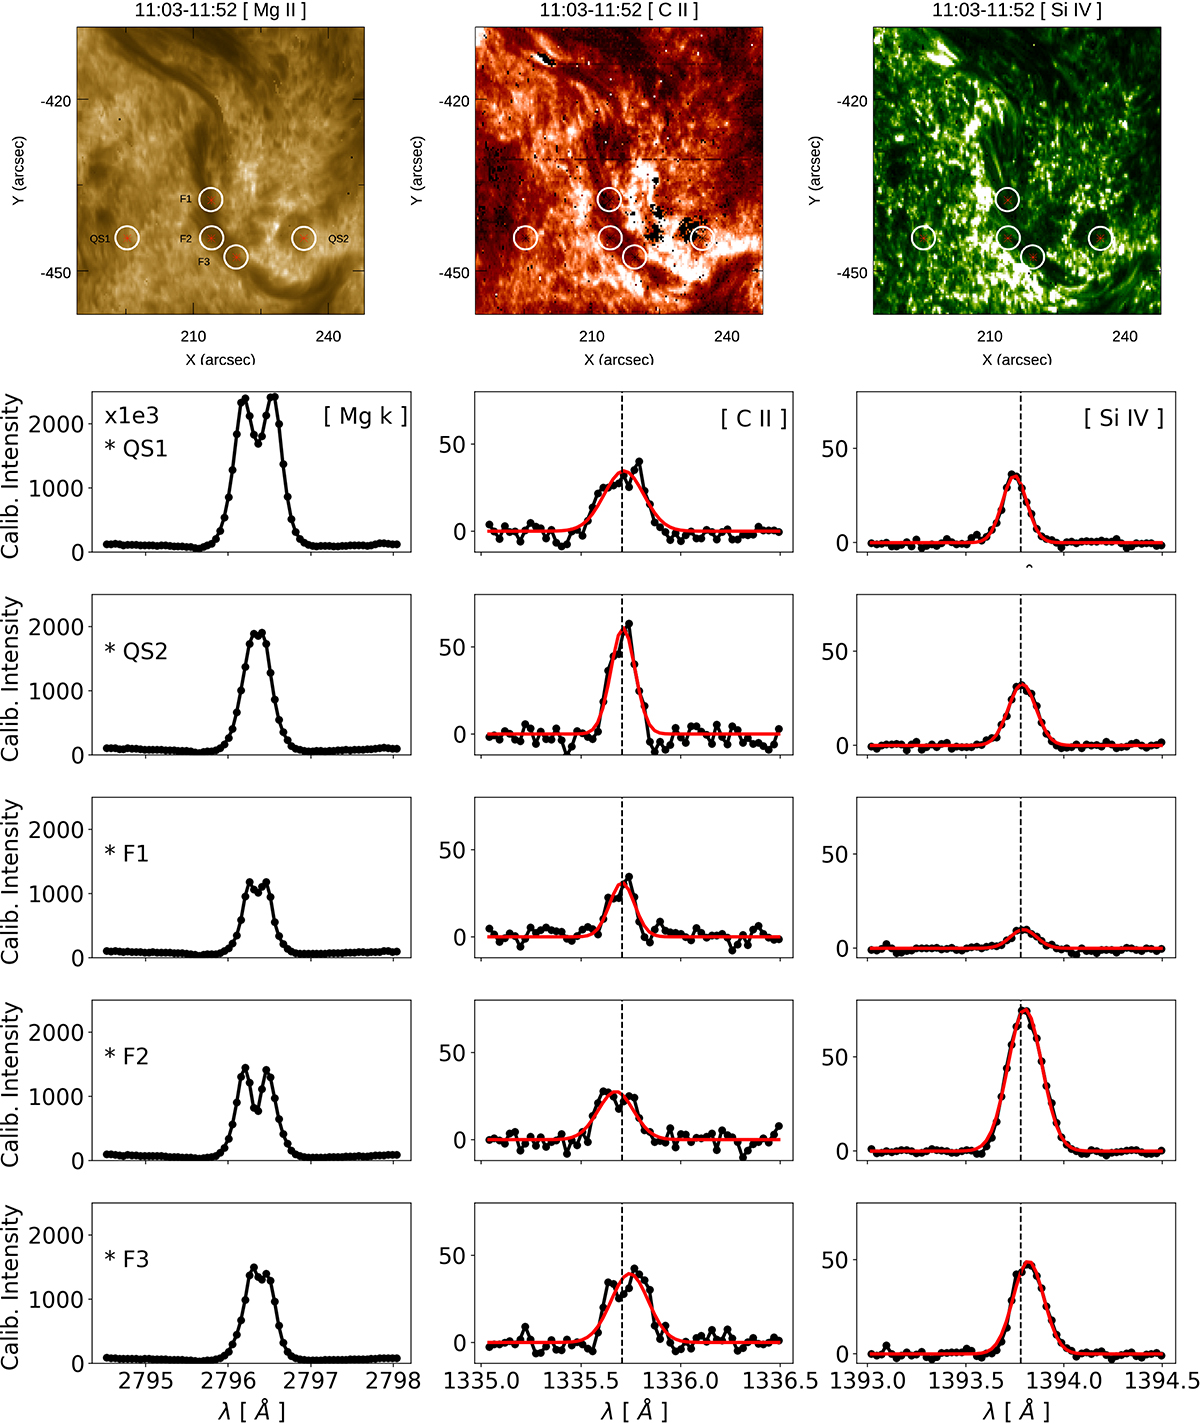
Fig. 5.
Download original image
From top to bottom: Peak-intensity maps and spectral profiles in locations marked with an asterisk in the respective intensity maps and their relative fits of Mg II k, Si IV 1394 Å, and C II 1335 Å during the middle IRIS raster scan (11:03–11:52 UT). Original spectral line profiles are shown in black and corresponding Gaussian fits are shown in red (for Si IV and C II spectral lines).
Current usage metrics show cumulative count of Article Views (full-text article views including HTML views, PDF and ePub downloads, according to the available data) and Abstracts Views on Vision4Press platform.
Data correspond to usage on the plateform after 2015. The current usage metrics is available 48-96 hours after online publication and is updated daily on week days.
Initial download of the metrics may take a while.