Fig. 8.
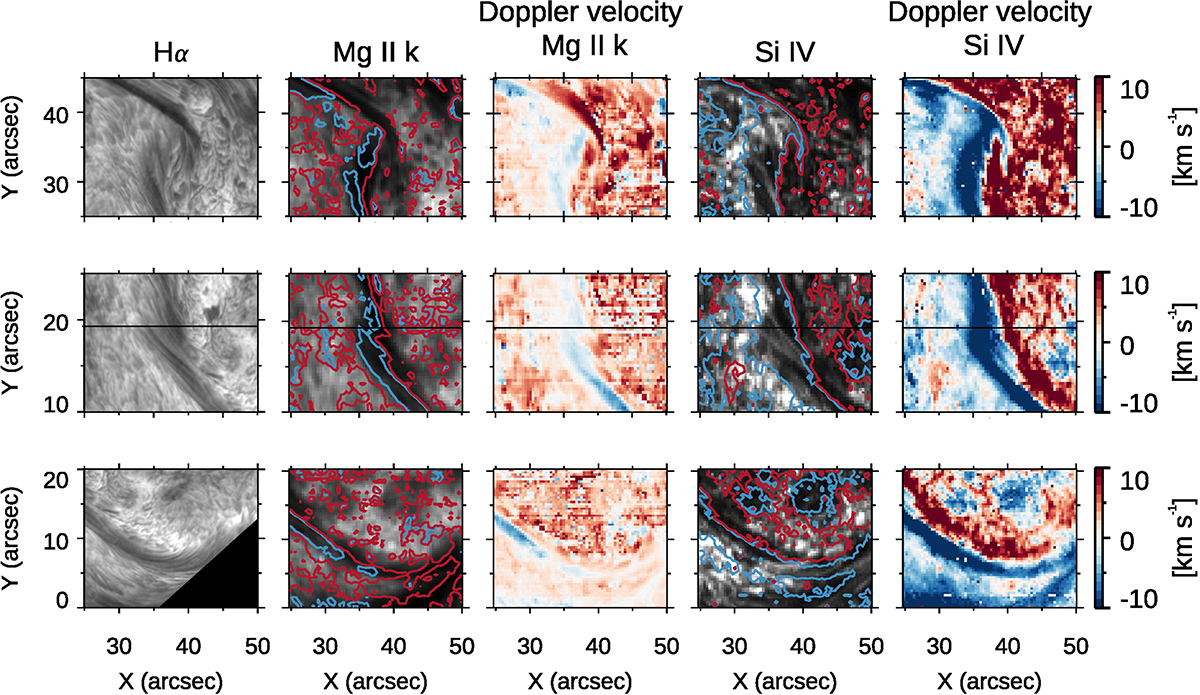
Download original image
Comparison of Hα and UV Mg II and Si IV IRIS intensity and Doppler velocity. From left to right: Hα intensity; Mg II k3 and Doppler velocity; Si IV peak intensity and Si IV Doppler-velocity maps for three RoIs (see the red boxes in the k3 intensity middle panels of Fig. 6). The Mg II k3 and Si IV Doppler-velocity maps are shown in the range from [−10, 10] to [−30,30] km s−1 as the original maps of Fig 10. In the Mg II k3 and Si IV intensity and Doppler-velocity maps, the red and blue contours represent upflows (−1 and −3 km s−1) and downflows (1 and 3 km s−1), respectively, corresponding to the Doppler velocities of Mg II k3 and Si IV.
Current usage metrics show cumulative count of Article Views (full-text article views including HTML views, PDF and ePub downloads, according to the available data) and Abstracts Views on Vision4Press platform.
Data correspond to usage on the plateform after 2015. The current usage metrics is available 48-96 hours after online publication and is updated daily on week days.
Initial download of the metrics may take a while.