Open Access
Fig. 1.
Download original image
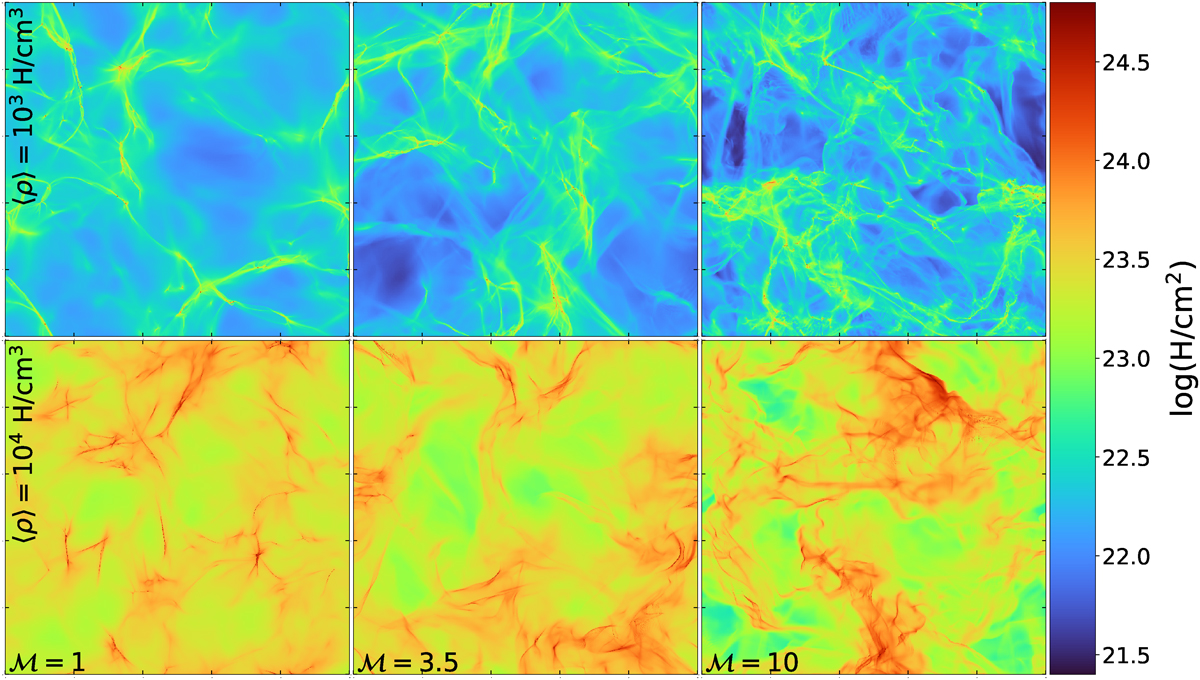
Column density maps for all runs growing in Mach number from left to right and in mean density from top to bottom. This images correspond to the moment when all runs have deposited a similar amount of mass into stellar particles.
Current usage metrics show cumulative count of Article Views (full-text article views including HTML views, PDF and ePub downloads, according to the available data) and Abstracts Views on Vision4Press platform.
Data correspond to usage on the plateform after 2015. The current usage metrics is available 48-96 hours after online publication and is updated daily on week days.
Initial download of the metrics may take a while.