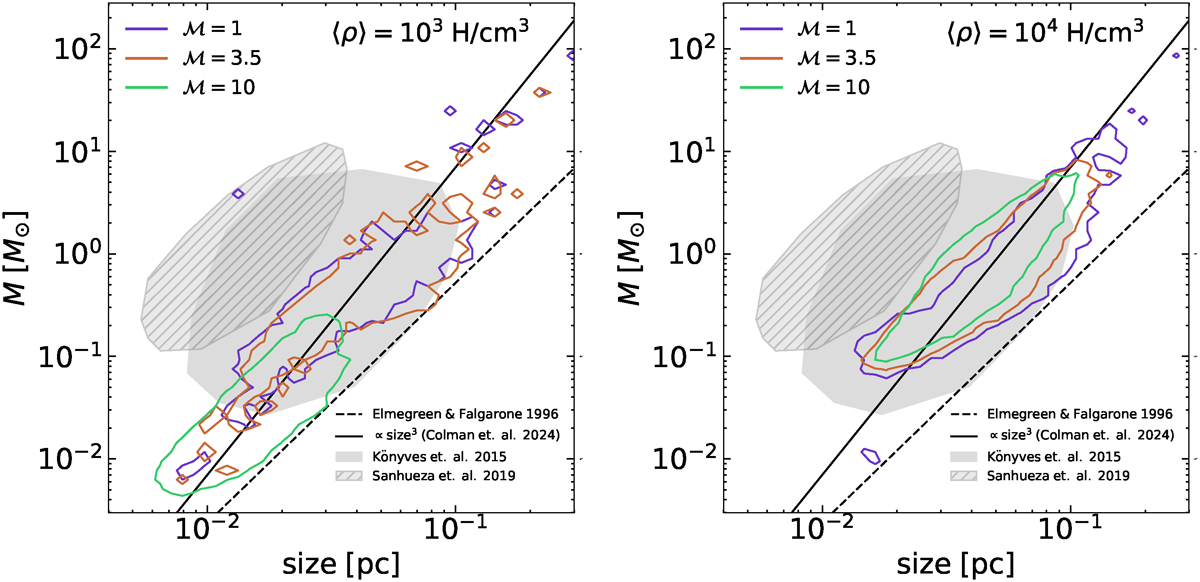
Fig. A.1.
Download original image
Mass vs size distribution of the recovered cores from the simulation with a mean density of 103 H/cm3 (left) and ⟨ρ⟩ = 104 H/cm3 (right) are shown in comparison with the core samples of Könyves et al. (2015) (solid grey shaded region) and Sanhueza et al. (2019) (grey hatched region). The contours cover 90% of the recovered cores from the simulations. The dashed line represents the mass–size relation from Elmegreen & Falgarone (1996), and the solid line illustrates the power-law behaviour observed in simulations across different scales by Colman et al. (2024).
Current usage metrics show cumulative count of Article Views (full-text article views including HTML views, PDF and ePub downloads, according to the available data) and Abstracts Views on Vision4Press platform.
Data correspond to usage on the plateform after 2015. The current usage metrics is available 48-96 hours after online publication and is updated daily on week days.
Initial download of the metrics may take a while.