Fig. 2.
Download original image
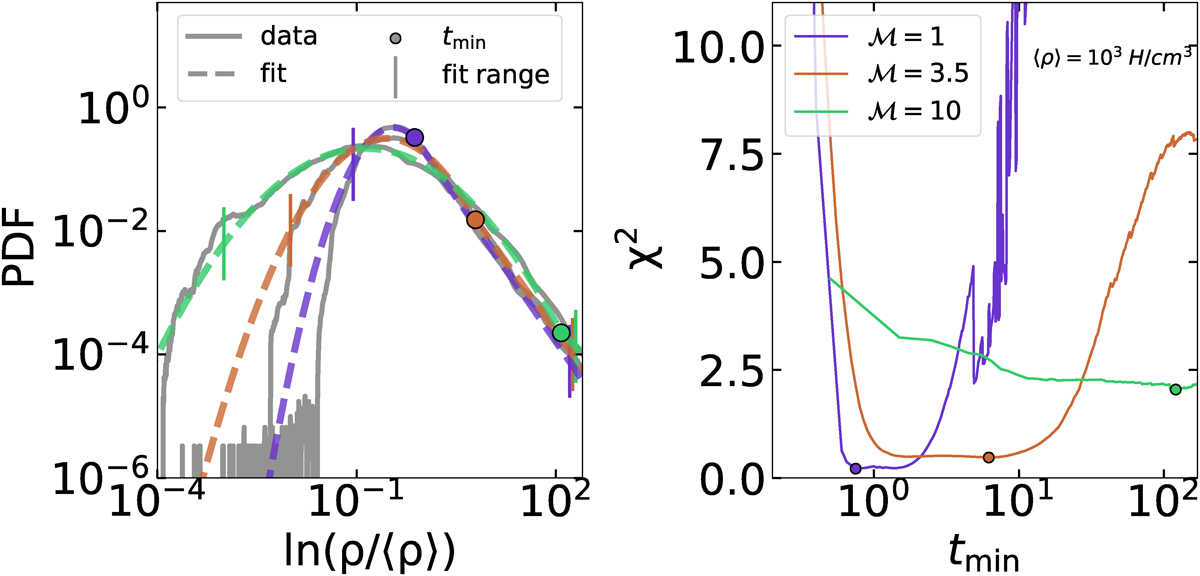
Gas PDF from three simulations with a mean density of ⟨ρ⟩ = 103 H/cm3 (left panel) is depicted. The solid grey lines represent the data, while the dashed lines indicate the fits using Equation (15). The fitted curves are shown in different colours, representing the three turbulence levels: ℳ = 1, 3.5, and 10, displayed in purple, orange, and green, respectively. The circle marker indicates the position of tmin, while the vertical lines mark the start and end of the fit range. The right panel illustrates the relationship between the goodness of fit, measured by the χ2 value, as tmin shifts from the peak to the end of the distribution.
Current usage metrics show cumulative count of Article Views (full-text article views including HTML views, PDF and ePub downloads, according to the available data) and Abstracts Views on Vision4Press platform.
Data correspond to usage on the plateform after 2015. The current usage metrics is available 48-96 hours after online publication and is updated daily on week days.
Initial download of the metrics may take a while.