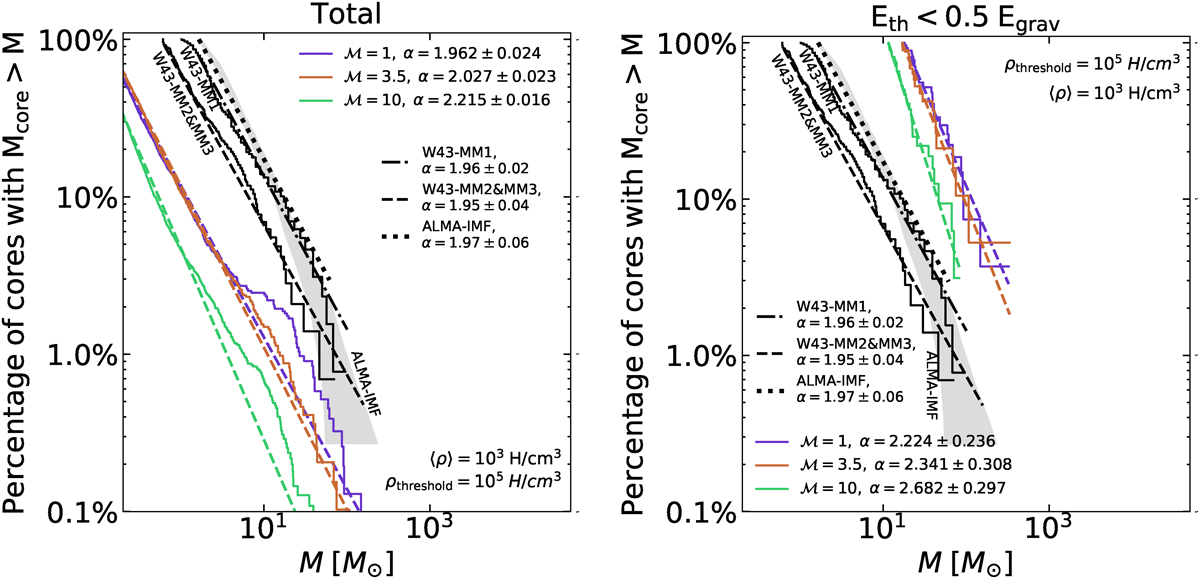
Fig. 4.
Download original image
Complementary cumulative distribution function of cores. Shown are the total population of cores (left) and those cores meeting the virial condition Eth < 0.5Ekin (right), for a mean density of ⟨ρ⟩ = 103 H/cm3. The data for the core populations are depicted as solid lines, whereas the estimated slopes for the MLE method are illustrated as dashed lines. The black curves represent observations from ALMA.
Current usage metrics show cumulative count of Article Views (full-text article views including HTML views, PDF and ePub downloads, according to the available data) and Abstracts Views on Vision4Press platform.
Data correspond to usage on the plateform after 2015. The current usage metrics is available 48-96 hours after online publication and is updated daily on week days.
Initial download of the metrics may take a while.