Fig. 6.
Download original image
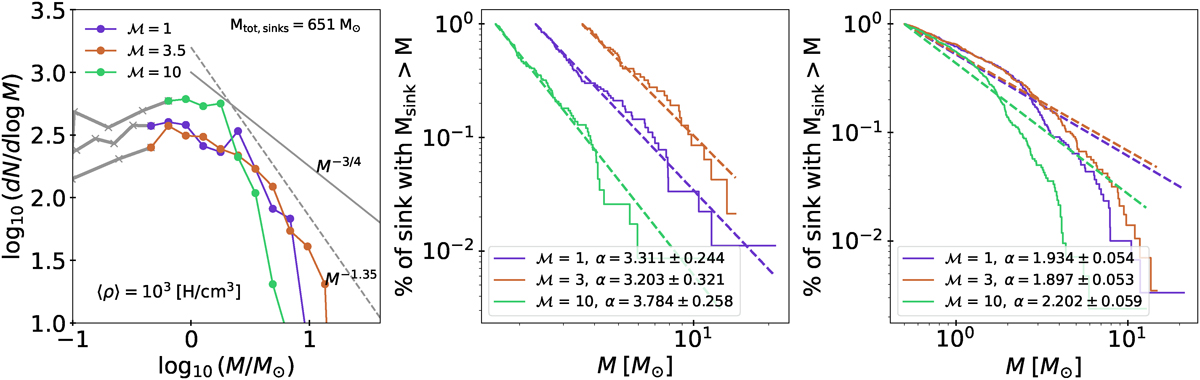
Left panel: IMF for simulations conducted at a lower mean density (⟨ρ⟩ = 103 H/cm3). The dashed and solid lines represent steep (Salpeter) and flatter power law, respectively, for guidance. The part of the IMF that is not used in this analysis is shown in grey. The middle and right panels present the CCDF, normalised to reflect the percentage of sinks with mass exceeding the values on the horizontal axis. The dashed lines in these panels indicate power laws determined by the MLE method. In the middle panel, the MLE method dynamically estimates the value of xmin, while in the right panel, xmin is set at 0.5 M⊙.
Current usage metrics show cumulative count of Article Views (full-text article views including HTML views, PDF and ePub downloads, according to the available data) and Abstracts Views on Vision4Press platform.
Data correspond to usage on the plateform after 2015. The current usage metrics is available 48-96 hours after online publication and is updated daily on week days.
Initial download of the metrics may take a while.