Fig. 8.
Download original image
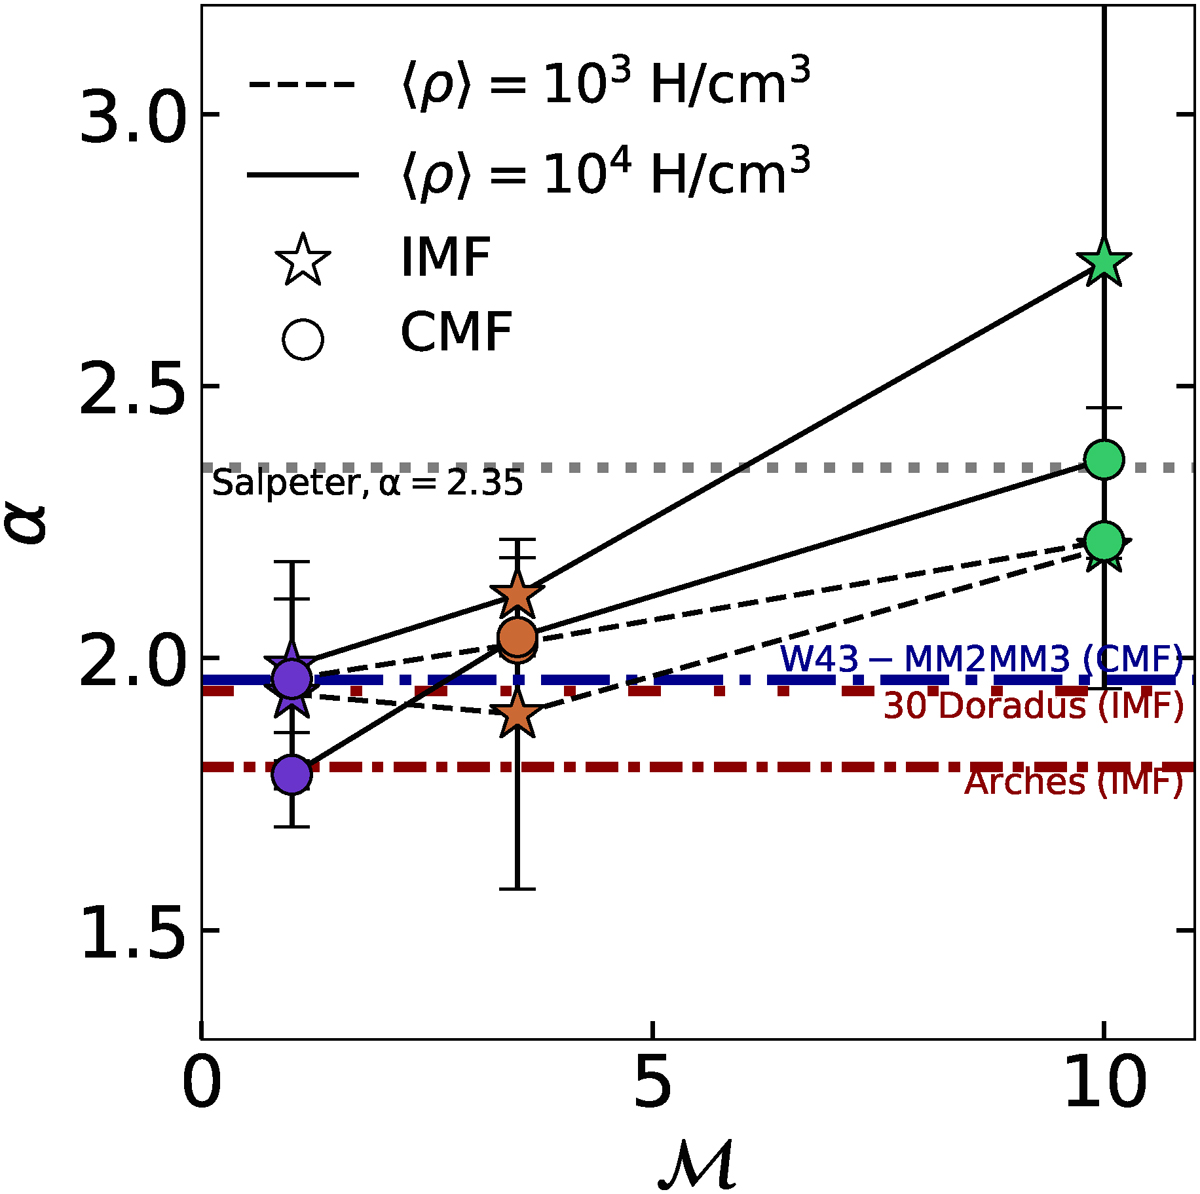
Relation of the power-law index α and the Mach number of the different CMF and IMF extracted from the simulations. The stars correspond to the IMF and the circles to the CMF. The dashed lines connect the results from the low-density cases and the solid lines the high-density cases. The horizontal grey dotted line shows the Salpeter value, the blue dot-dashed line is the index corresponding the CMF measured in W43-MM2&MM3 ridge (Pouteau et al. 2022), the red dot-dot-dashed line corresponds to the index of the IMF tail of 30 Doradus (Schneider et al. 2018), and the red dense dot-dashed line shows the index of the IMF tail of the Arches cluster (Hosek et al. 2019).
Current usage metrics show cumulative count of Article Views (full-text article views including HTML views, PDF and ePub downloads, according to the available data) and Abstracts Views on Vision4Press platform.
Data correspond to usage on the plateform after 2015. The current usage metrics is available 48-96 hours after online publication and is updated daily on week days.
Initial download of the metrics may take a while.