Fig. 3.
Download original image
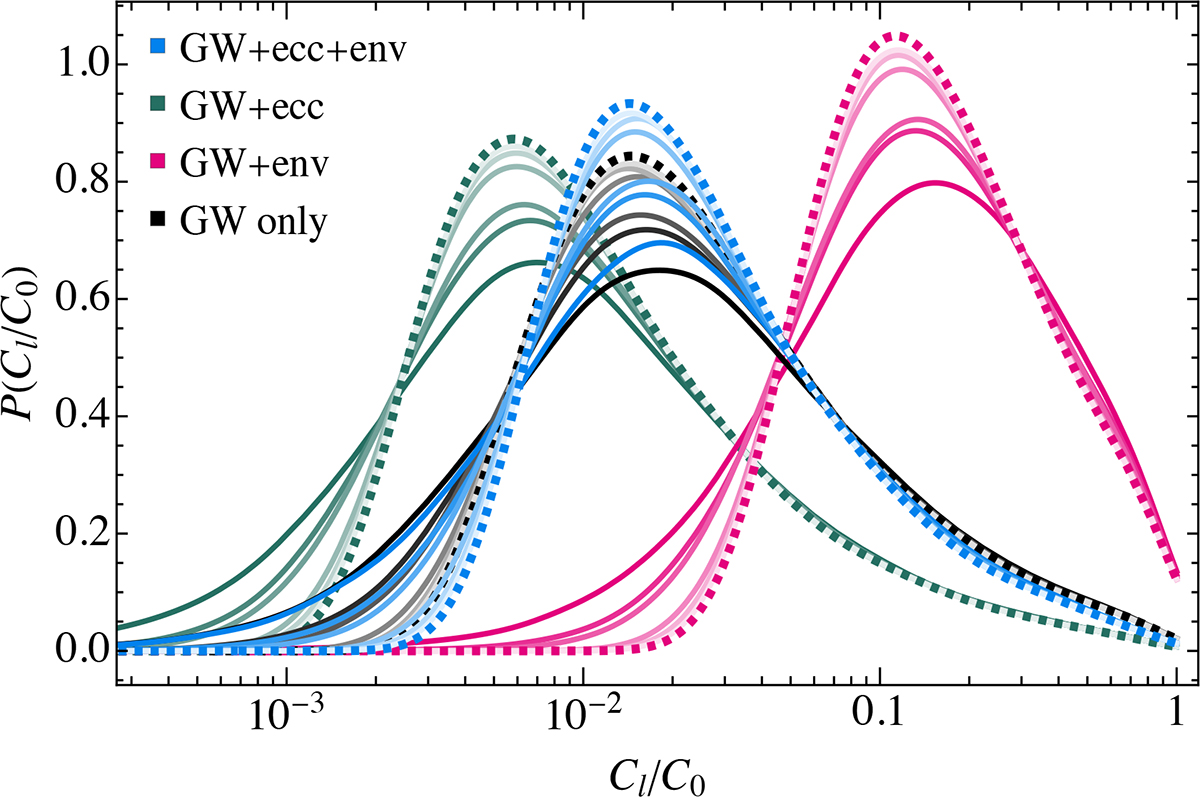
Probability distributions for the normalised anisotropy power spectrum coefficients. Solid curves show the distributions of the multipole ratios for l ∈ {1, 2, 3, 10, 20, 40}, where lighter colours indicate higher multipoles, across four models at the first PTA frequency band. The dashed curve represents the distribution of the sum of the fractional energy density squared of all GW-emitting sources, C∞/C0.
Current usage metrics show cumulative count of Article Views (full-text article views including HTML views, PDF and ePub downloads, according to the available data) and Abstracts Views on Vision4Press platform.
Data correspond to usage on the plateform after 2015. The current usage metrics is available 48-96 hours after online publication and is updated daily on week days.
Initial download of the metrics may take a while.