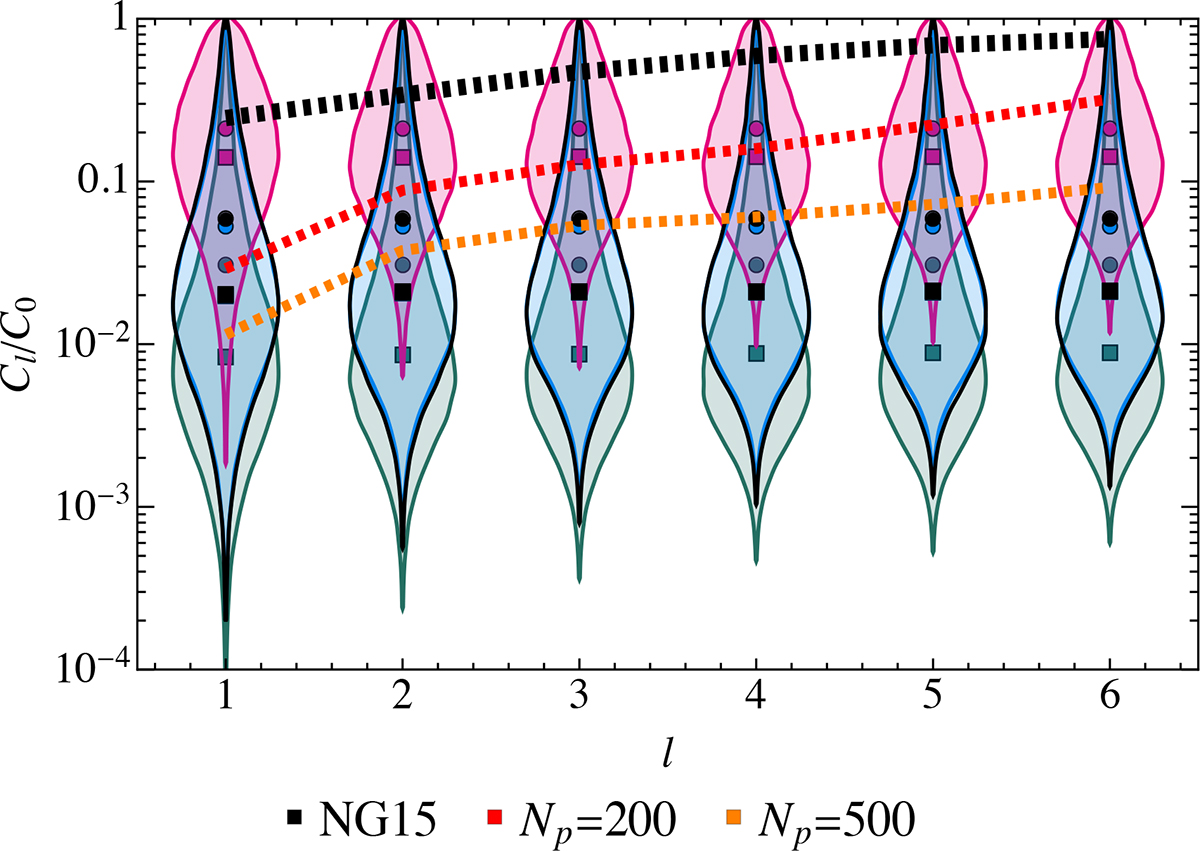
Fig. 4.
Download original image
Ratio between the zeroth-order and higher-order coefficients of the GW anisotropy power spectrum. The distributions are obtained from 105 sky realisations at a GW frequency of 1.98 nHz. The medians and means of each distribution are indicated by squares and circles respectively. The dashed black curve represents the NG15 upper bound (Agazie et al. 2023e), while other dashed curves indicate future prospects assuming EPTA-like noise and a 15-year observation time (Depta et al. 2025). The colours of the violin plots correspond to the same models as in Fig. 1.
Current usage metrics show cumulative count of Article Views (full-text article views including HTML views, PDF and ePub downloads, according to the available data) and Abstracts Views on Vision4Press platform.
Data correspond to usage on the plateform after 2015. The current usage metrics is available 48-96 hours after online publication and is updated daily on week days.
Initial download of the metrics may take a while.