Open Access
Fig. 5.
Download original image
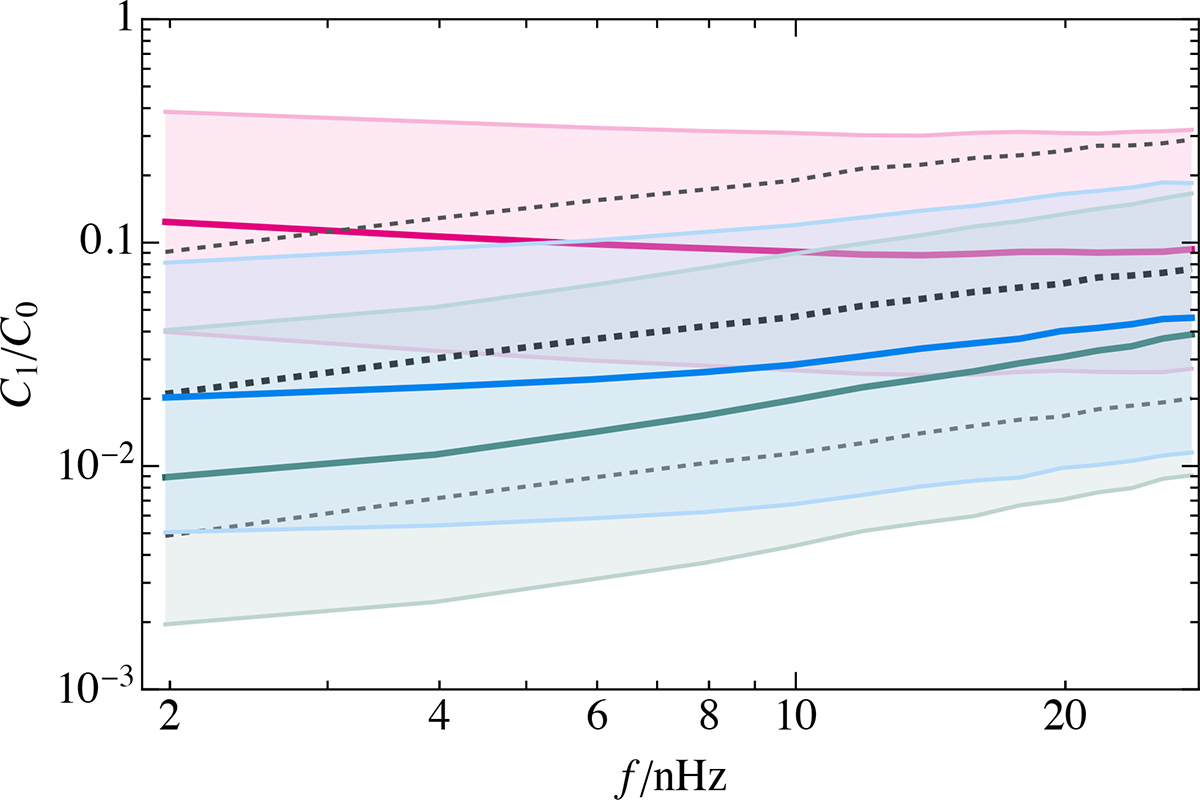
Frequency scaling of the median normalised power spectrum coefficient at l = 1 for each of the four models considered. The shaded areas indicate the 1σ confidence intervals around the median. The colours correspond to the same models as in Fig. 1. The GW-only model is shown with a dashed line for clarity.
Current usage metrics show cumulative count of Article Views (full-text article views including HTML views, PDF and ePub downloads, according to the available data) and Abstracts Views on Vision4Press platform.
Data correspond to usage on the plateform after 2015. The current usage metrics is available 48-96 hours after online publication and is updated daily on week days.
Initial download of the metrics may take a while.