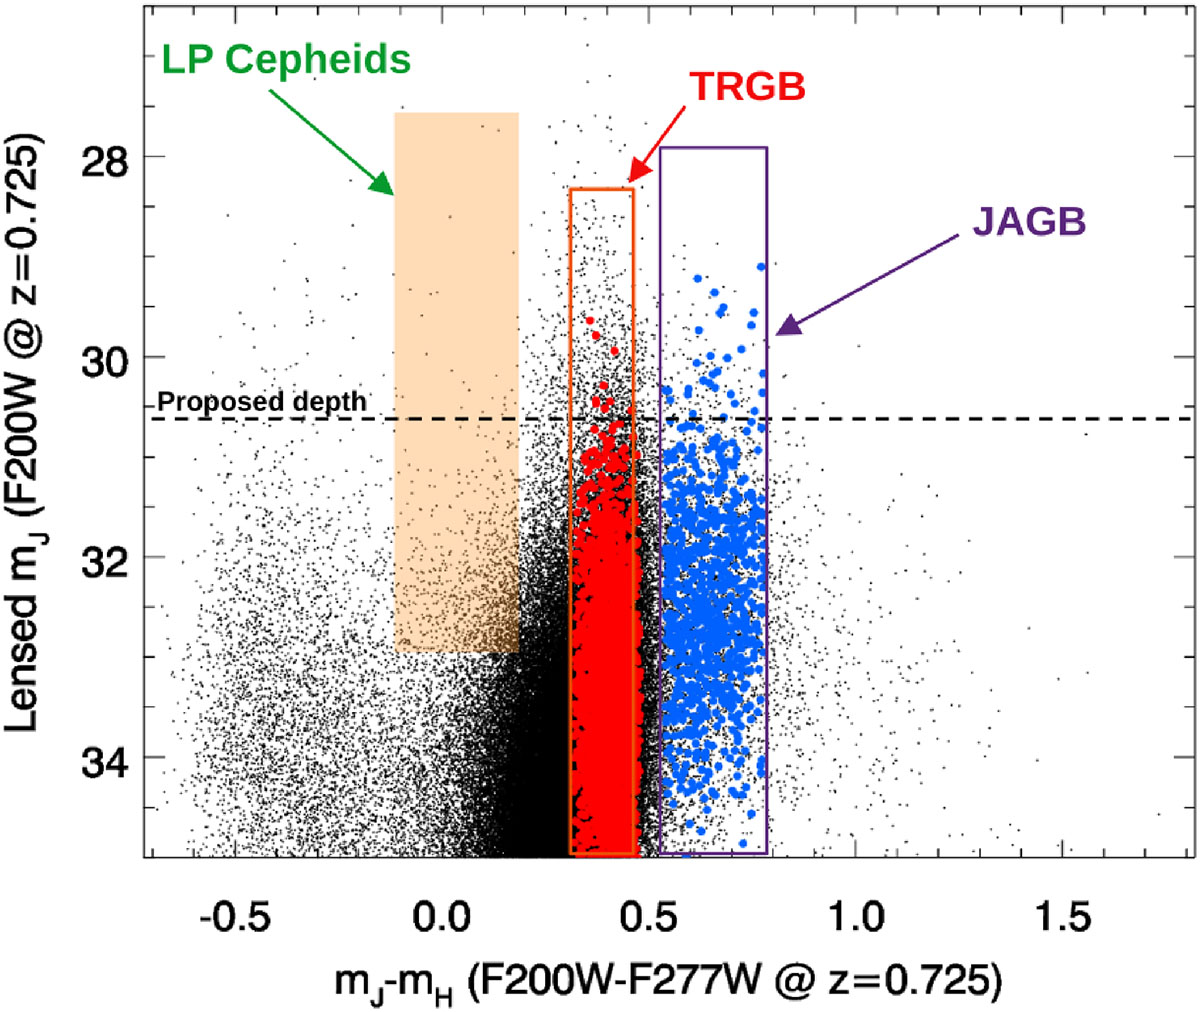
Fig. 3.
Download original image
Color–magnitude diagram of the stars in Figure 1 at z = 0.725 after being magnified by A370 and microlenses (Equation 1). The red points correspond to stars in the narrow TRGB magnitude range marked in red in Figure 1, and the blue dots correspond to stars in the blue JAGB region. The random magnifications spread the stars’ magnitudes over the ranges shown, but the magnification is wavelength-independent. A depth of 30.6 mag in F200W, shown by the horizontal dashed line, is needed to measure the TRGB knee feature. This detection limit is achievable with JWST in exposures of 16.7 hours, and there are ≈1100 stars brighter than this limit.
Current usage metrics show cumulative count of Article Views (full-text article views including HTML views, PDF and ePub downloads, according to the available data) and Abstracts Views on Vision4Press platform.
Data correspond to usage on the plateform after 2015. The current usage metrics is available 48-96 hours after online publication and is updated daily on week days.
Initial download of the metrics may take a while.