Fig. 5.
Download original image
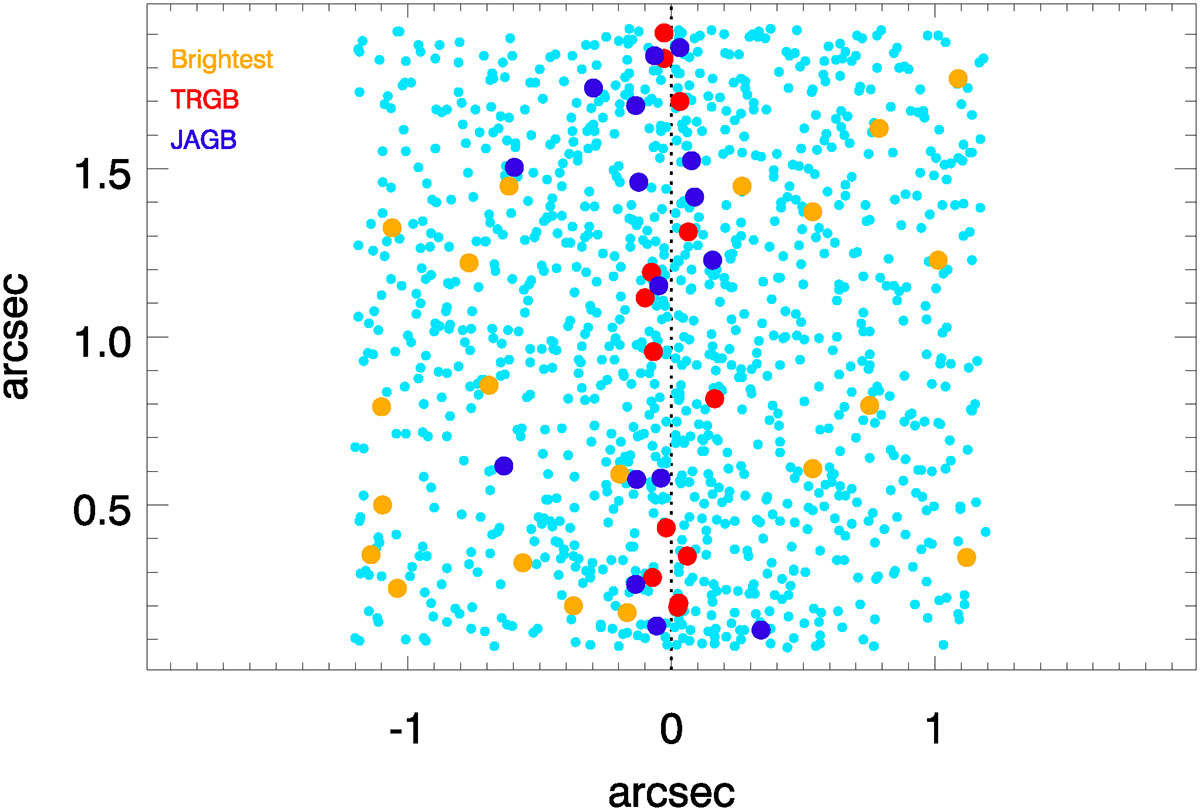
Simulated spatial distribution of lensed events. The dashed vertical line represents the cluster CC. The points represent all 1122 stars above 30.6 mag in Figures 3 and 4. Red and dark blue dots represent detected stars in the TRGB and JAGB regions respectively. Orange dots represent the most luminous stars in the LMC (MJ < 34 before lensing and MJ < 30.6 after lensing). Cyan points represent other stars, mostly highly microlensed red giants intrinsically fainter than the TRGB. The x location of each star was derived from a simple model where μm scales with d as μm = 60″/d. This gives μm = 50 at the maximum d illustrated. The y coordinate shown is a random value between ![]() and
and ![]() , but this is a compressed scale. The Dragon arc intersects the cluster CC at multiple locations, and the effective y axis is ≈10″ long.
, but this is a compressed scale. The Dragon arc intersects the cluster CC at multiple locations, and the effective y axis is ≈10″ long.
Current usage metrics show cumulative count of Article Views (full-text article views including HTML views, PDF and ePub downloads, according to the available data) and Abstracts Views on Vision4Press platform.
Data correspond to usage on the plateform after 2015. The current usage metrics is available 48-96 hours after online publication and is updated daily on week days.
Initial download of the metrics may take a while.