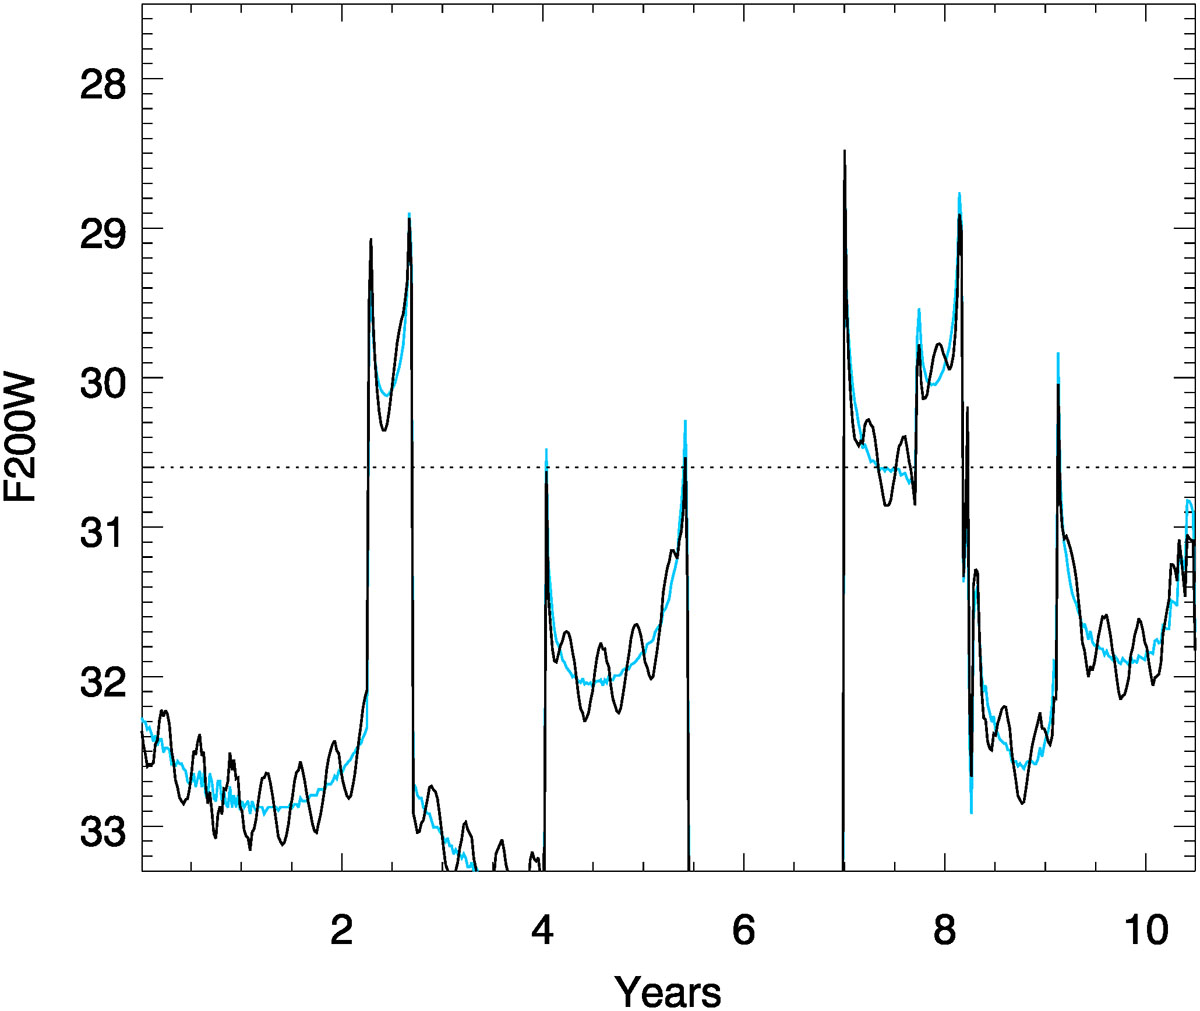
Fig. 7.
Download original image
Portion of the light curve of a P = 50 day Cepheid in the Dragon at macromodel magnification μm = 161 and under the influence of microlenses (Σ* = 30 M⊙/pc2). The effect of the underlying magnification from the macromodel plus micromodel is shown as a blue curve, while the net effect including the sinusoidal periodic variation of the Cepheid is shown as a black curve. The dotted line marks the detection limit of 30.6 mag in JWST’s F200W.
Current usage metrics show cumulative count of Article Views (full-text article views including HTML views, PDF and ePub downloads, according to the available data) and Abstracts Views on Vision4Press platform.
Data correspond to usage on the plateform after 2015. The current usage metrics is available 48-96 hours after online publication and is updated daily on week days.
Initial download of the metrics may take a while.