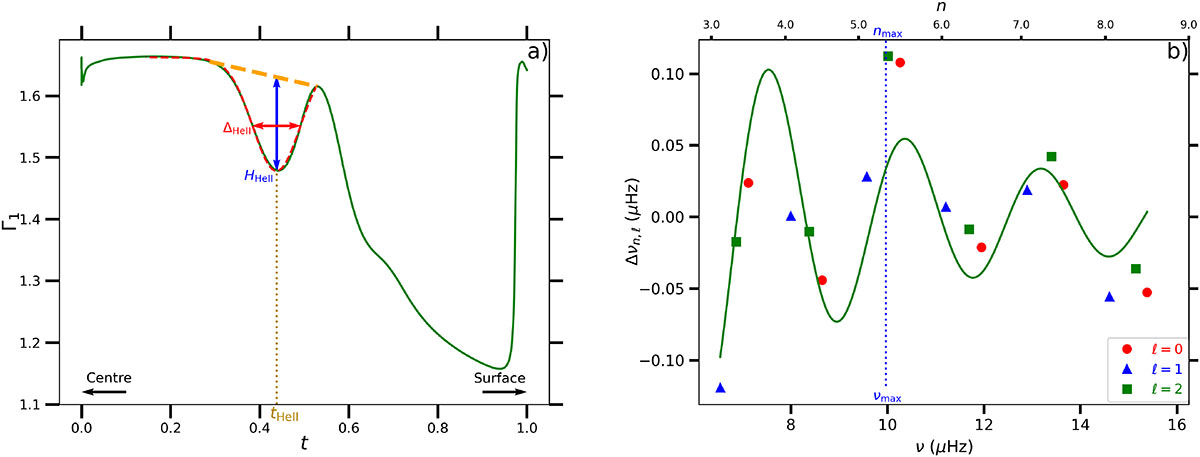
Fig. 2.
Download original image
(a) Profile of the first adiabatic exponent Γ1 as a function of the normalised acoustic radius in a 1 M⊙ RGB model computed with MESA at Δν = 1.65 μHz. The parameters of the Γ1 variations (HHeII, tHeII, and bHeII) are directly shown in the figure. The solid green line is the Γ1 profile throughout the star. The thick dashed orange line indicates the baseline that connects the local maximum after the dip caused by the second He-ionisation with the Γ1 profile before the dip. The thin dashed red line gives the fit of the Γ1 profile with Eq. (12) around the dip. (b) Glitch modulation induced by the second He-ionisation zone in the same model, as in the left panel. The local large separation Δνn, ℓ is shown in red circles, blue triangles, and green squares for radial, dipole, and quadrupole modes, respectively. The solid green line is the damped oscillator model given by Eq. (10) fitted to the data points. We point out that the data points are plotted at the mean frequencies (νn, ℓ + νn + 1, ℓ)/2. The upper x-axis indicates the radial order of ℓ = 0 modes, and the dotted blue line locates the maximum oscillation power.
Current usage metrics show cumulative count of Article Views (full-text article views including HTML views, PDF and ePub downloads, according to the available data) and Abstracts Views on Vision4Press platform.
Data correspond to usage on the plateform after 2015. The current usage metrics is available 48-96 hours after online publication and is updated daily on week days.
Initial download of the metrics may take a while.