Fig. 3.
Download original image
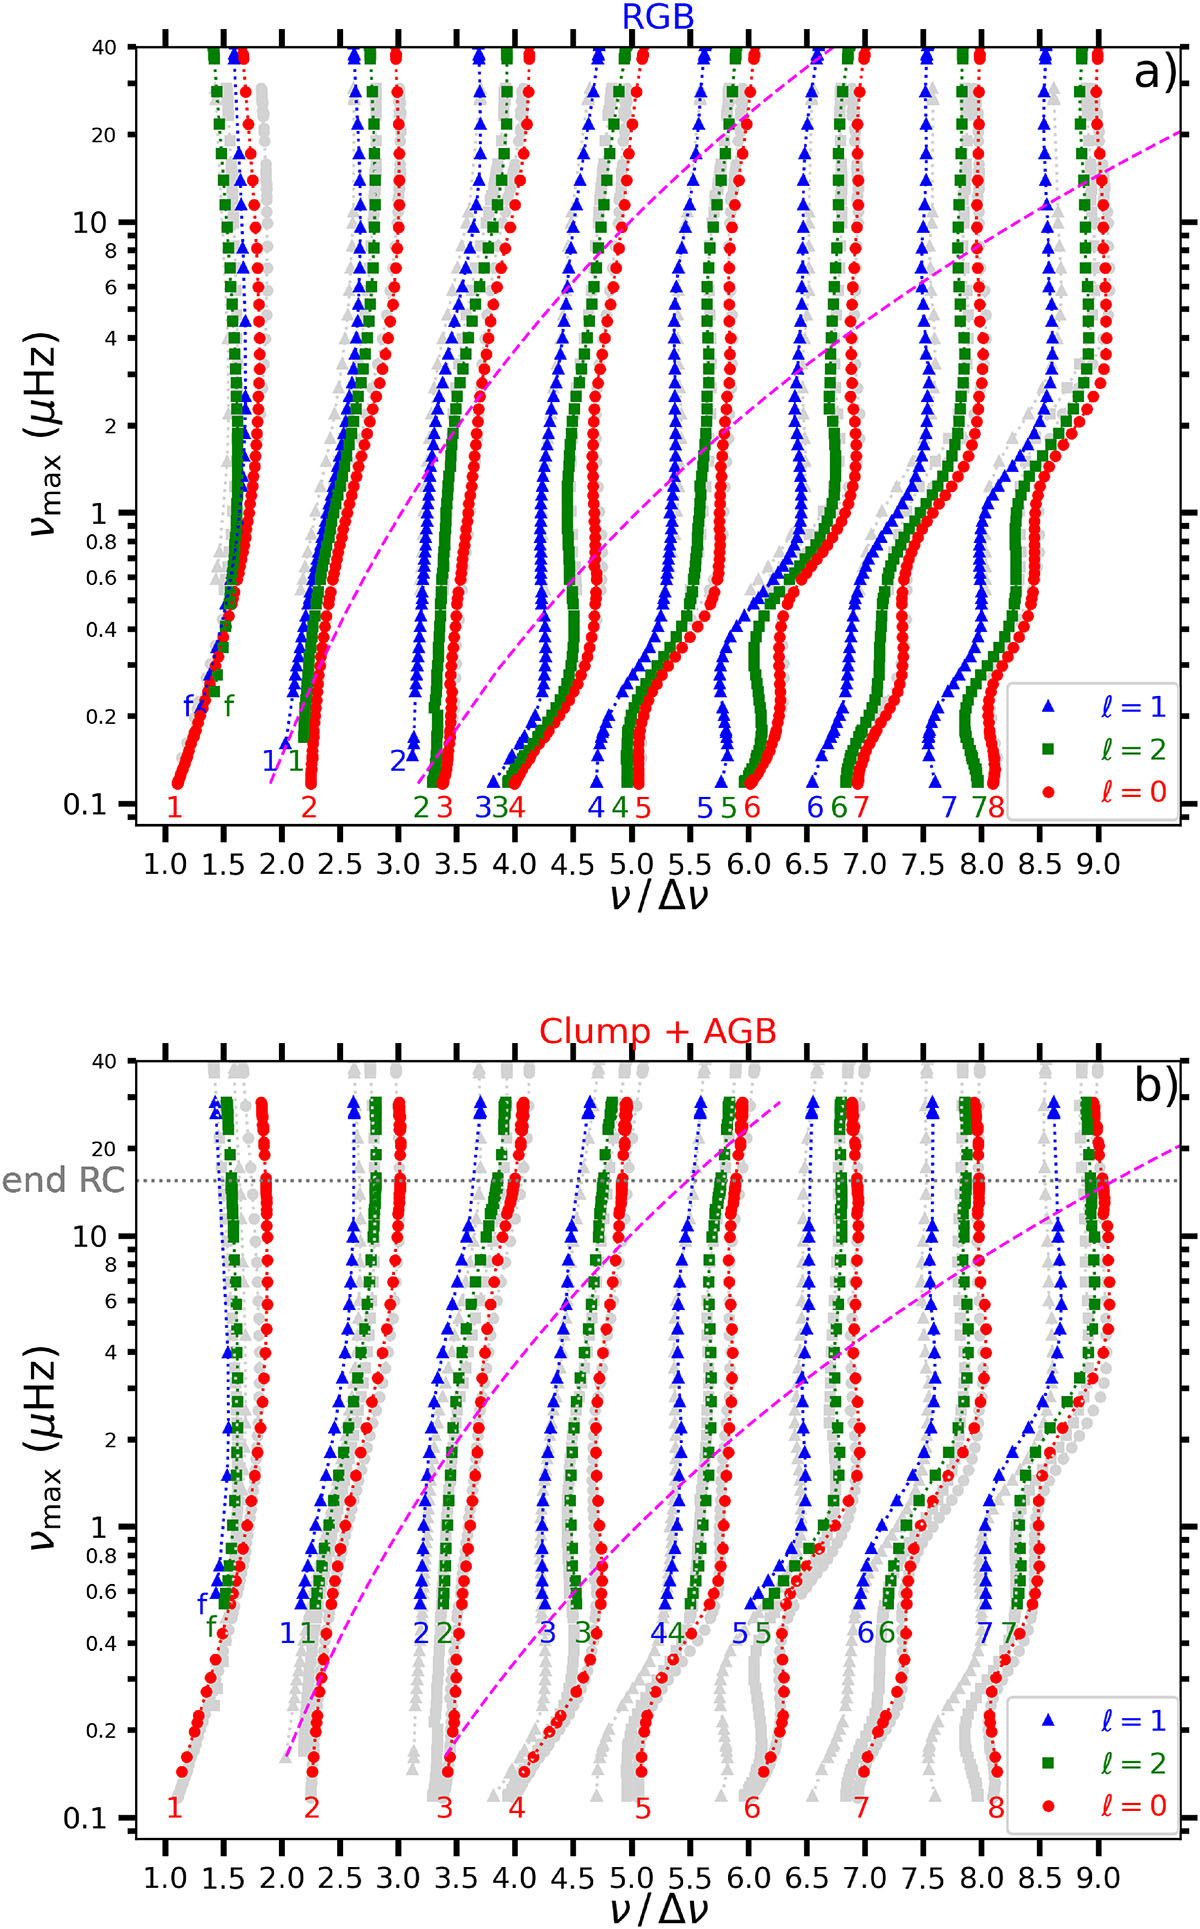
Model frequencies from radial order n = 1 up to n = 8 computed with ADIPLS for a 1 M⊙ track at solar metallicity. The MESA models are computed with the reference input physics listed in Table 1. Radial, dipole, and quadrupole modes are shown in red circles, blue triangles, and green squares, respectively. For the RGB (panel a), the grey frequencies are clump plus AGB models for comparison, and vice versa for the clump plus AGB (panel b). The non-radial modes (ℓ = 1, 2) are computed by setting the squared Brunt–Väisälä frequency ![]() in the core, but retaining the original Γ1 profile, as described in Sect. 3. Modes of the same degree ℓ and same radial order n are connected by dotted lines, in red for ℓ = 0, in blue for ℓ = 1, and in green for ℓ = 2. The radial orders are indicated at the lower edge of each branch, with the same colour code as the mode degree ℓ. The presence of non-radial modes with frequencies below that of the fundamental radial mode are labelled by an ‘f’. The dashed magenta lines delimit the typical frequency range [νmax − 0.25 νmax, νmax + 0.25 νmax] between which model frequencies are likely to be observed in the oscillation spectrum (White et al. 2011). In panel b, the dotted grey line shows the end of the clump phase, defined as the point when the central helium mass fraction goes below 0.01. We warn that the code could not find the ℓ = 1 modes during the clump phase and the early-AGB (νmax ∈ [10, 25] μHz) when setting
in the core, but retaining the original Γ1 profile, as described in Sect. 3. Modes of the same degree ℓ and same radial order n are connected by dotted lines, in red for ℓ = 0, in blue for ℓ = 1, and in green for ℓ = 2. The radial orders are indicated at the lower edge of each branch, with the same colour code as the mode degree ℓ. The presence of non-radial modes with frequencies below that of the fundamental radial mode are labelled by an ‘f’. The dashed magenta lines delimit the typical frequency range [νmax − 0.25 νmax, νmax + 0.25 νmax] between which model frequencies are likely to be observed in the oscillation spectrum (White et al. 2011). In panel b, the dotted grey line shows the end of the clump phase, defined as the point when the central helium mass fraction goes below 0.01. We warn that the code could not find the ℓ = 1 modes during the clump phase and the early-AGB (νmax ∈ [10, 25] μHz) when setting ![]() in the core. Because the code had trouble outputting the non-radial modes for high-luminosity AGB models, we stopped the computation of non-radial modes of νmax ≤ 0.5 μHz after the He-core burning phase.
in the core. Because the code had trouble outputting the non-radial modes for high-luminosity AGB models, we stopped the computation of non-radial modes of νmax ≤ 0.5 μHz after the He-core burning phase.
Current usage metrics show cumulative count of Article Views (full-text article views including HTML views, PDF and ePub downloads, according to the available data) and Abstracts Views on Vision4Press platform.
Data correspond to usage on the plateform after 2015. The current usage metrics is available 48-96 hours after online publication and is updated daily on week days.
Initial download of the metrics may take a while.