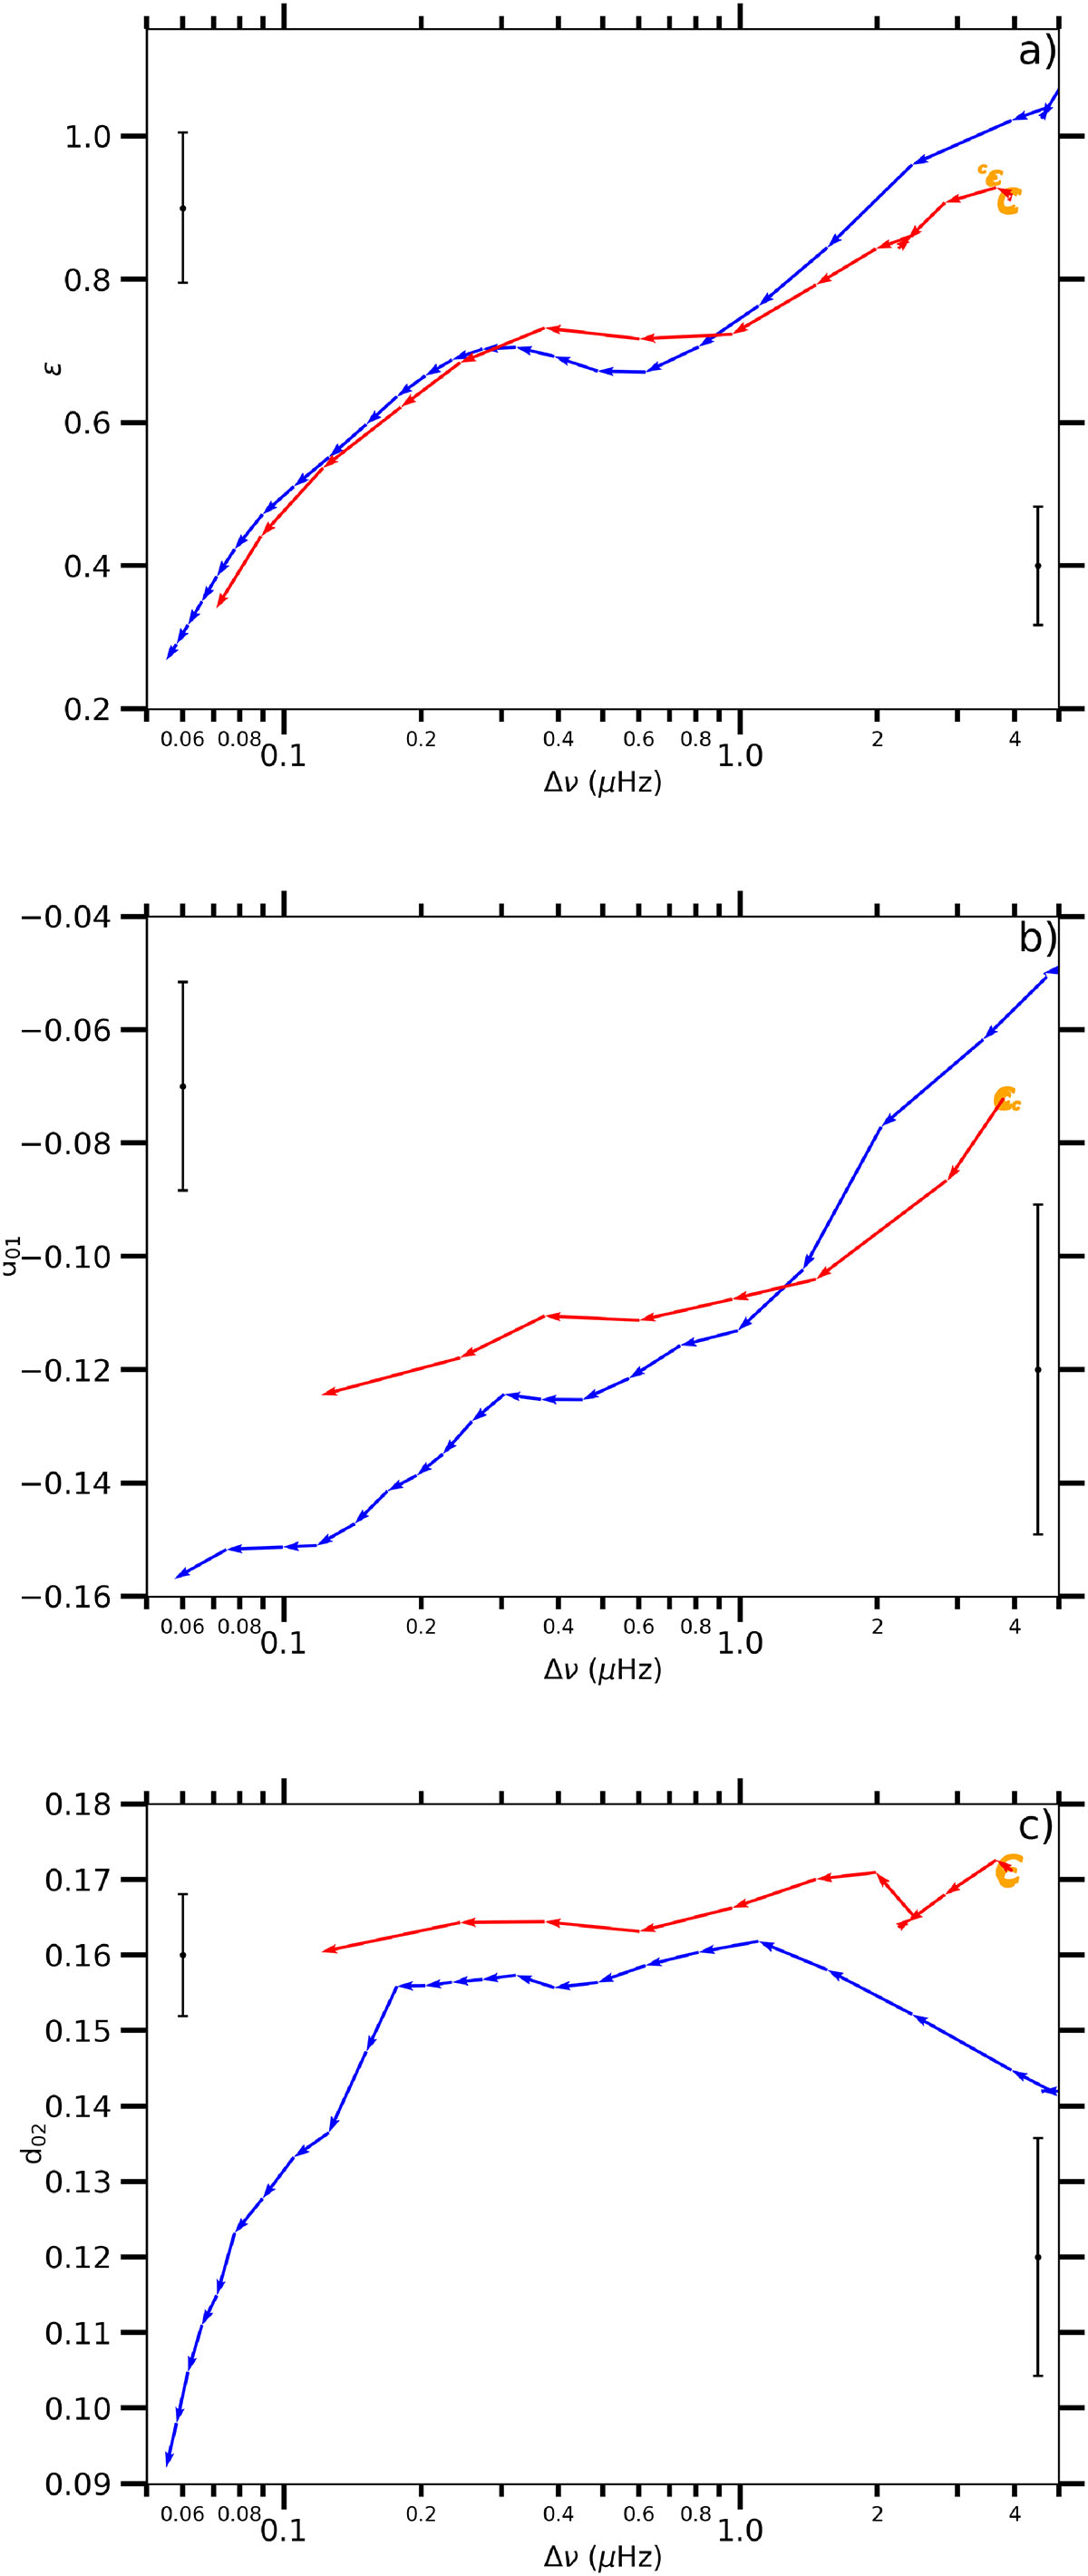
Fig. 4.
Download original image
Synthetic seismic parameters extracted from the p-mode frequencies computed with ADIPLS, as described in Sect. 3.3. The MESA models are computed with the reference input physics listed in Table 1, with M = 1.0 M⊙ and solar metallicity. (a) Variation of the acoustic offset ε as a function of Δν, with an emphasis on the evolutionary stage. Clump stars are shown by the orange ‘C’ symbols while the RGB and AGB are colour-coded in blue and red, respectively. ‘C’ symbols show the progress in the clump stage. Small (large, respectively), symbols correspond to the early (late, respectively), clump phase. The arrows indicate the direction of evolution. (b) and (c) Dimensionless small separations d0ℓ as a function of Δν. Mean error bars estimated for Δν below or above 0.5 μHz are represented on each panel.
Current usage metrics show cumulative count of Article Views (full-text article views including HTML views, PDF and ePub downloads, according to the available data) and Abstracts Views on Vision4Press platform.
Data correspond to usage on the plateform after 2015. The current usage metrics is available 48-96 hours after online publication and is updated daily on week days.
Initial download of the metrics may take a while.