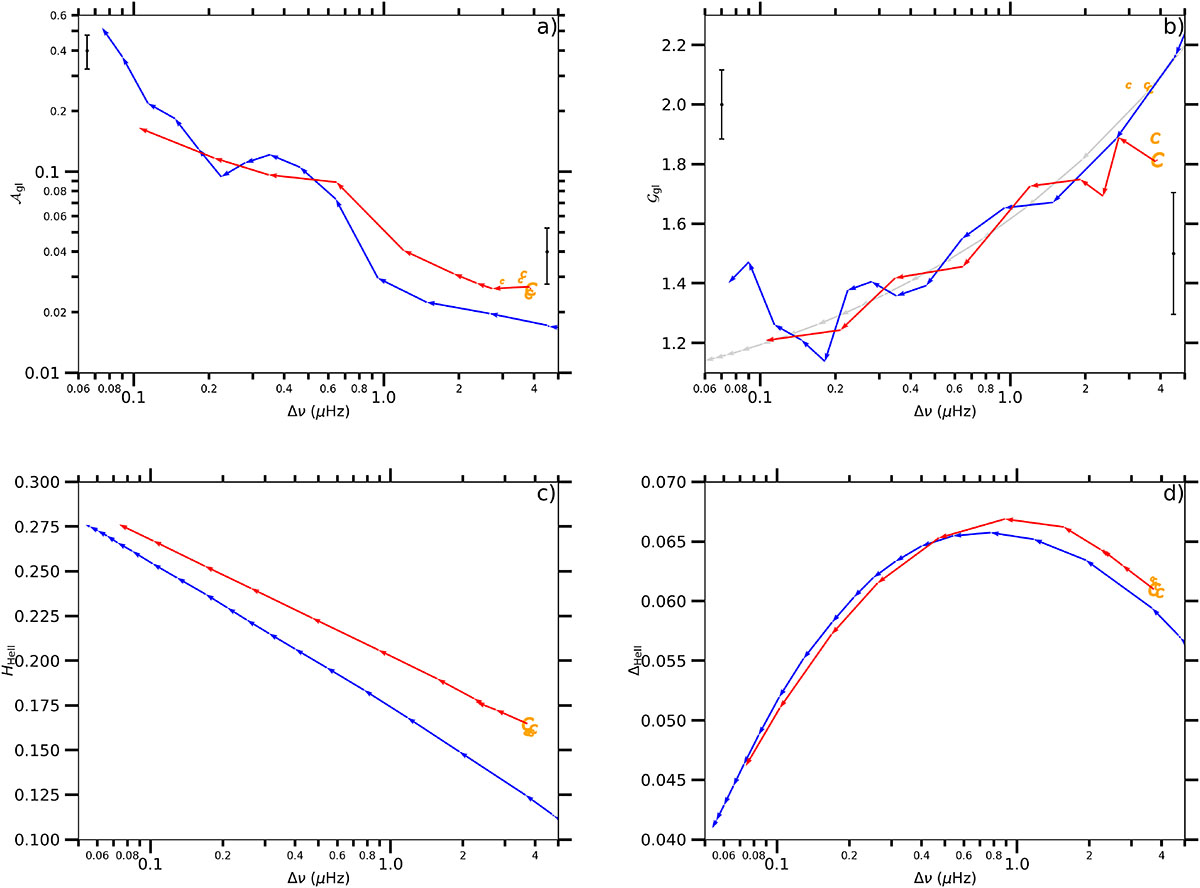
Fig. 5.
Download original image
Synthetic glitch and structure parameters computed with MESA and ADIPLS. The MESA models are the same as those shown in Fig. 4. The glitch amplitude 𝒜gl and period 𝒢gl are shown on the (a) and (b) panels, respectively, while the amplitude HHeII and the width bHeII of the HeII zone in the Γ1 profile are exhibited on the (c) and (d) panels, respectively. The label matches that of Fig. 4. In panel b, the additional solid light grey line is the modulation period expected from the location of the HeII ionisation zone tHeII, which is computed according to Eq. (13).
Current usage metrics show cumulative count of Article Views (full-text article views including HTML views, PDF and ePub downloads, according to the available data) and Abstracts Views on Vision4Press platform.
Data correspond to usage on the plateform after 2015. The current usage metrics is available 48-96 hours after online publication and is updated daily on week days.
Initial download of the metrics may take a while.