Fig. 7.
Download original image
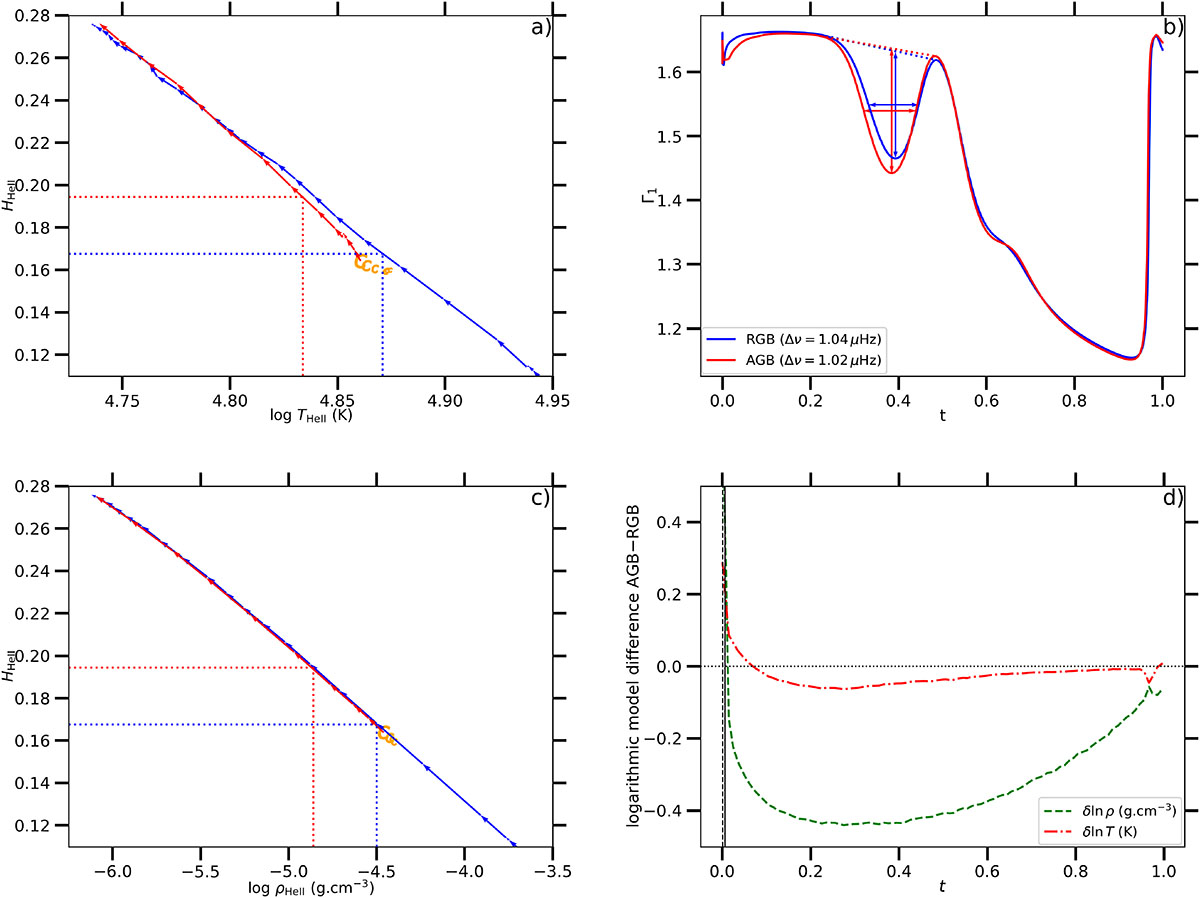
(a) Dependence of the amplitude HHeII on the average temperature log THeII in the HeII zone. The input physics and label are the same as in Fig. 5 for models of mass 1 M⊙ and solar metallicity. Dotted lines show the log THeII − HHeII coordinates of the RGB and AGB models presented in the right panel. (b) Γ1 profiles on the RGB and AGB roughly at a similar Δν = 1.03 μHz. The arrows indicate the amplitude and the width of the Γ1 variation at the helium-second ionisation zone, in blue on the RGB and red on the AGB. (c) Same as panel a, but with the average density log ρHeII in the HeII zone instead of log THeII. (d) Logarithmic differences between the AGB and RGB models shown in (b) of the temperature (dot-dashed red line) and density (dashed green line) as a function of the normalised acoustic radius. The vertical solid and dashed lines indicate the location of the base of the convective envelope in the RGB and AGB models, respectively.
Current usage metrics show cumulative count of Article Views (full-text article views including HTML views, PDF and ePub downloads, according to the available data) and Abstracts Views on Vision4Press platform.
Data correspond to usage on the plateform after 2015. The current usage metrics is available 48-96 hours after online publication and is updated daily on week days.
Initial download of the metrics may take a while.