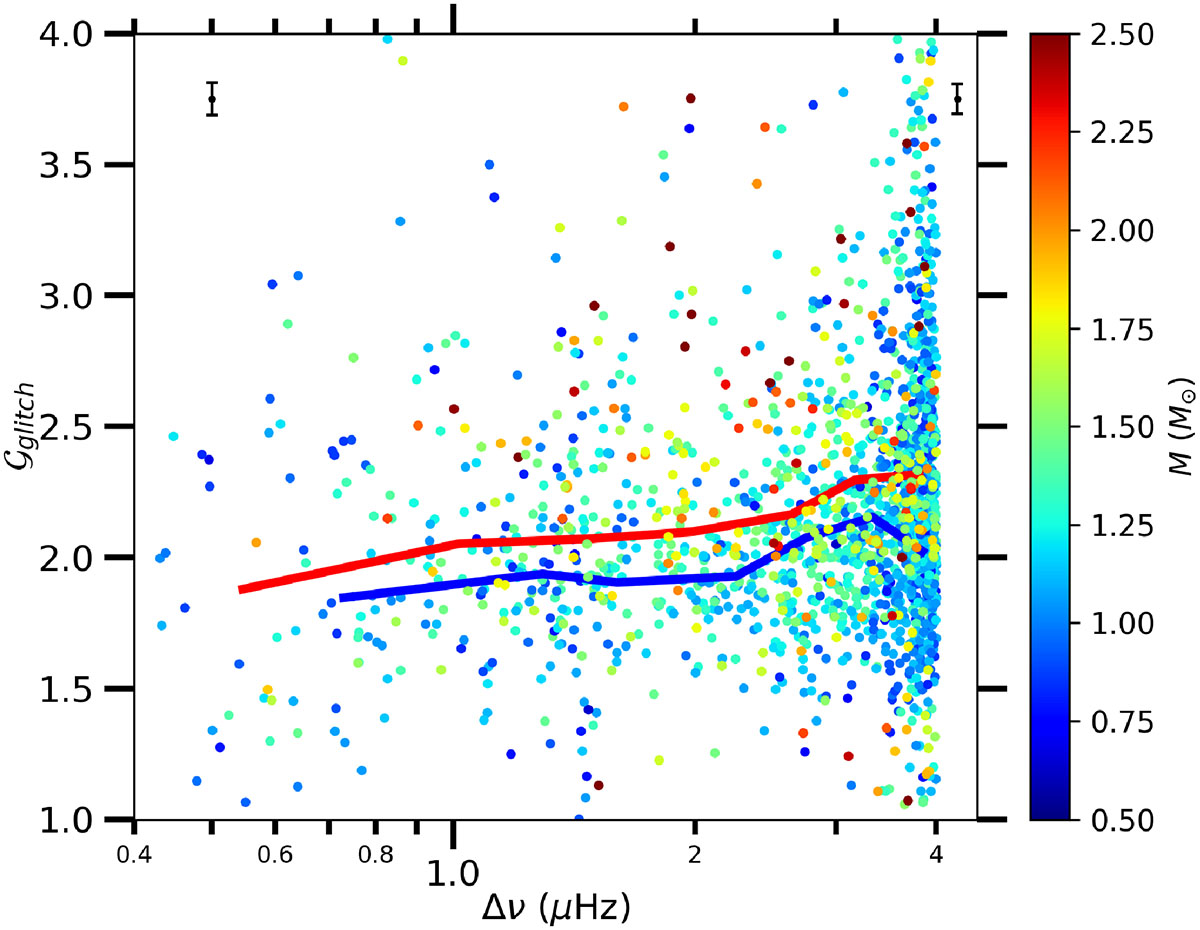
Fig. A.1.
Download original image
Glitch modulation period derived from the Kepler data used in Dréau et al. (2021) as a function of Δν, where the stellar mass is colour-coded. Mean error bars estimated for Δν below or above 1 μHz are represented. The thick solid lines are the median values in bins of 0.5 μHz Δν, regardless of the evolutionary stage, shown in blue for low-mass stars (M ≤ 1.2 M⊙) and in red for high-mass stars (M ≥ 1.2 M⊙).
Current usage metrics show cumulative count of Article Views (full-text article views including HTML views, PDF and ePub downloads, according to the available data) and Abstracts Views on Vision4Press platform.
Data correspond to usage on the plateform after 2015. The current usage metrics is available 48-96 hours after online publication and is updated daily on week days.
Initial download of the metrics may take a while.