Fig. 3.
Download original image
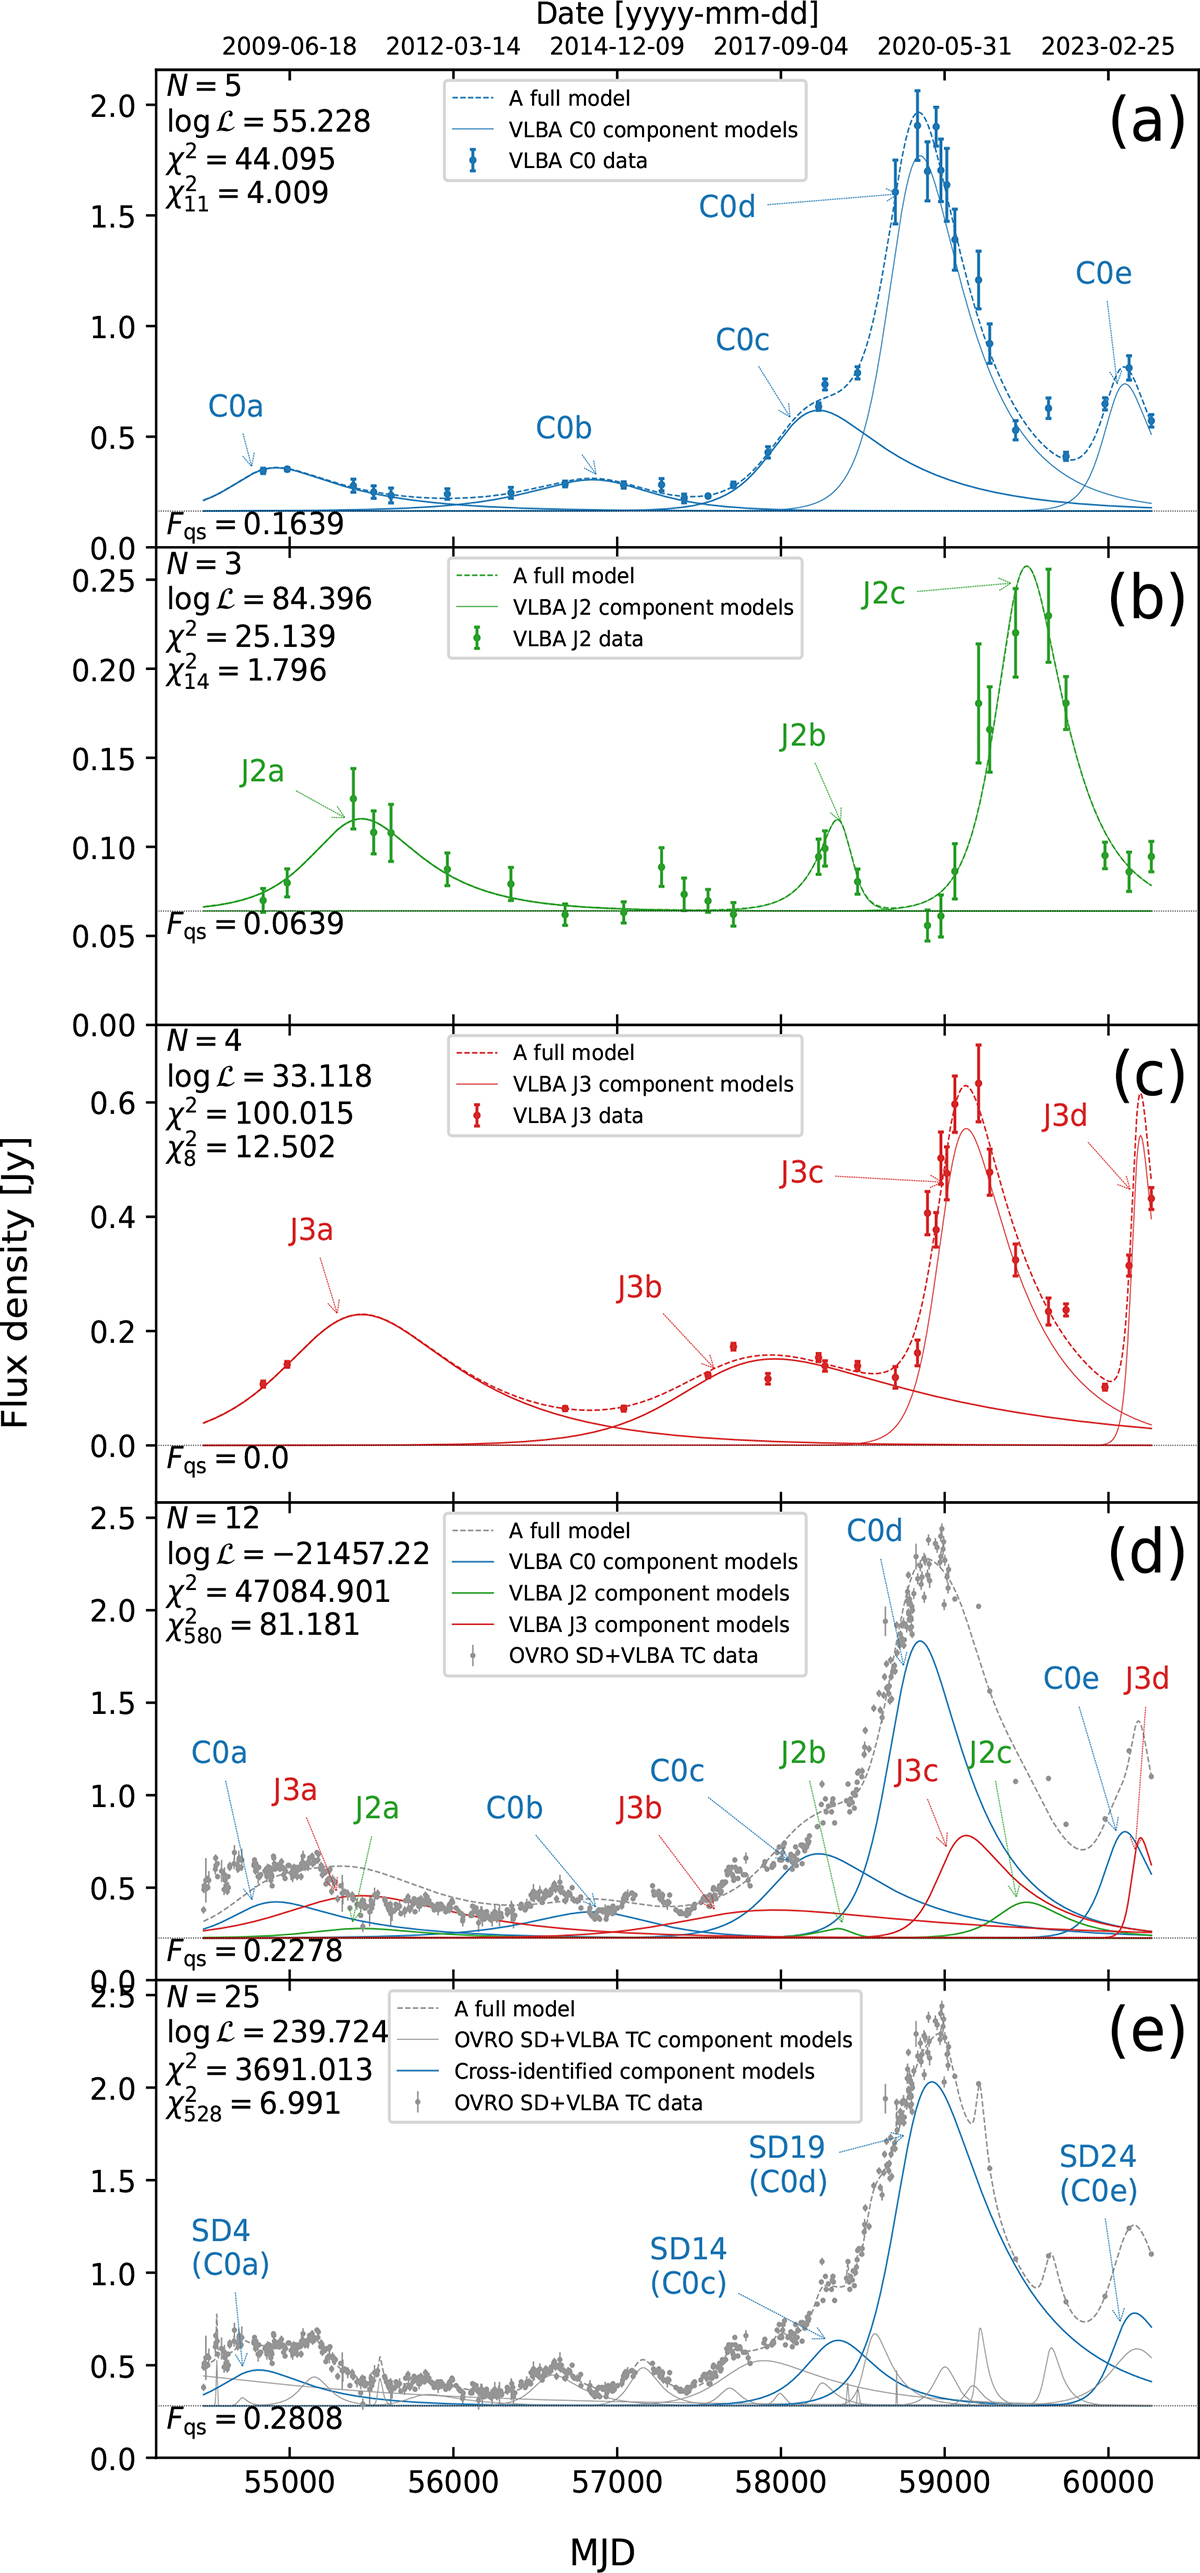
Flare decomposition plots of the VLBA C0 (a), J2 (b), and J3 (c), respectively. For a purpose of comparison, the flare model components in panels (a)–(c) overlap the OVRO SD+VLBA TC light curve in panel (d). A flare decomposition plot (e) of the OVRO SD+VLBA TC light curve using the initial sample shown in panel (d). The solid lines are the single flare model components. The dashed line in each panel describes the sum of all flare model components and the quiescent flux density. All panels note the number of components N, log-likelihood logℒ, χ2, and reduced ![]() (d is the degrees of freedom) in the upper left corner. The quiescent flux density (Fqs) is noted in the lower left corner (as well as by the horizontal dotted lines).
(d is the degrees of freedom) in the upper left corner. The quiescent flux density (Fqs) is noted in the lower left corner (as well as by the horizontal dotted lines).
Current usage metrics show cumulative count of Article Views (full-text article views including HTML views, PDF and ePub downloads, according to the available data) and Abstracts Views on Vision4Press platform.
Data correspond to usage on the plateform after 2015. The current usage metrics is available 48-96 hours after online publication and is updated daily on week days.
Initial download of the metrics may take a while.