Fig. 4.
Download original image
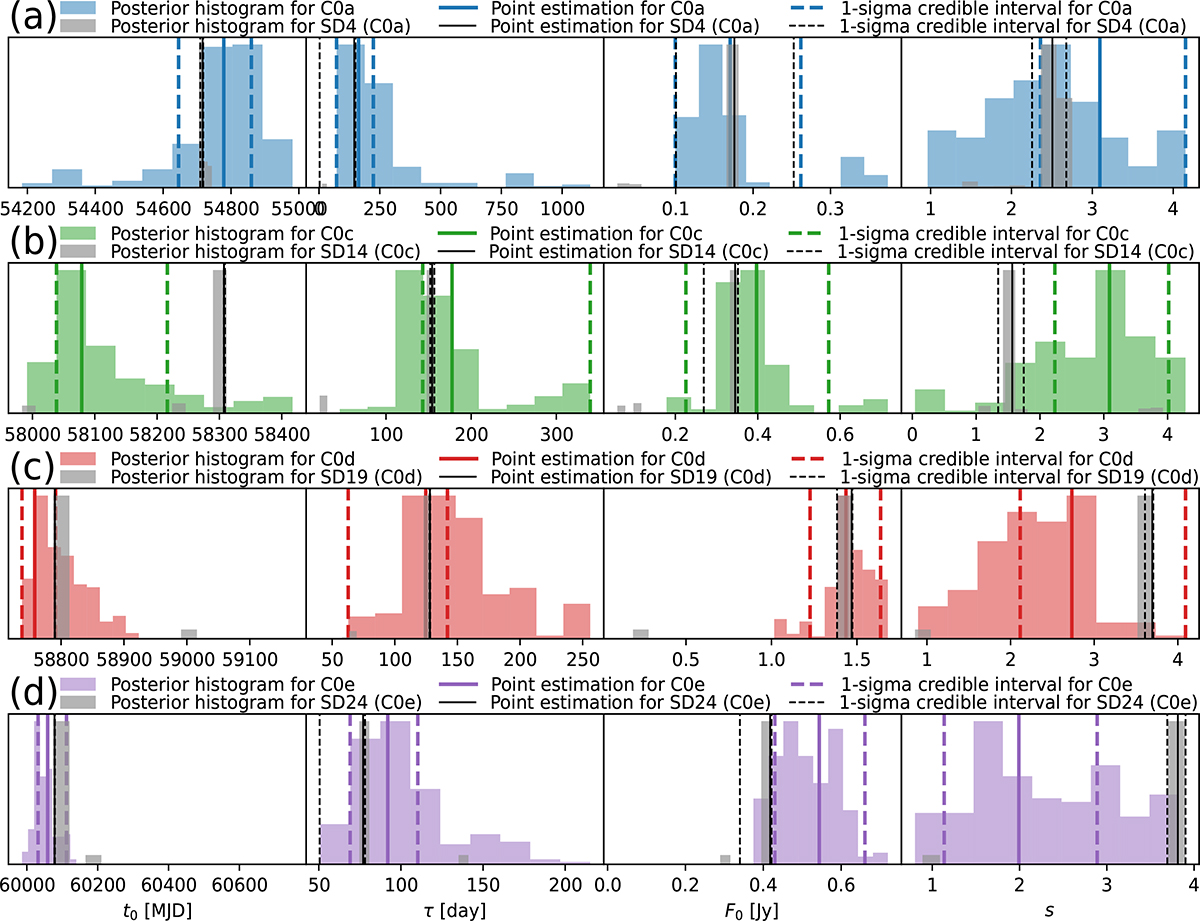
Posterior distributions, point estimates, and credible intervals of the cross-identified flare decomposition parameters t0, τ, F0, and s for flares C0a, C0c, C0d, and C0e (color plots from panels (a) to (d)) and SD4 (C0a), SD14 (C0c), SD19 (C0d), and SD24 (C0e) (gray and black plots from panels (a) to (d)). The bar plots illustrate the posterior distributions. The solid and dashed line plots note the point estimates and interval estimates, respectively.
Current usage metrics show cumulative count of Article Views (full-text article views including HTML views, PDF and ePub downloads, according to the available data) and Abstracts Views on Vision4Press platform.
Data correspond to usage on the plateform after 2015. The current usage metrics is available 48-96 hours after online publication and is updated daily on week days.
Initial download of the metrics may take a while.