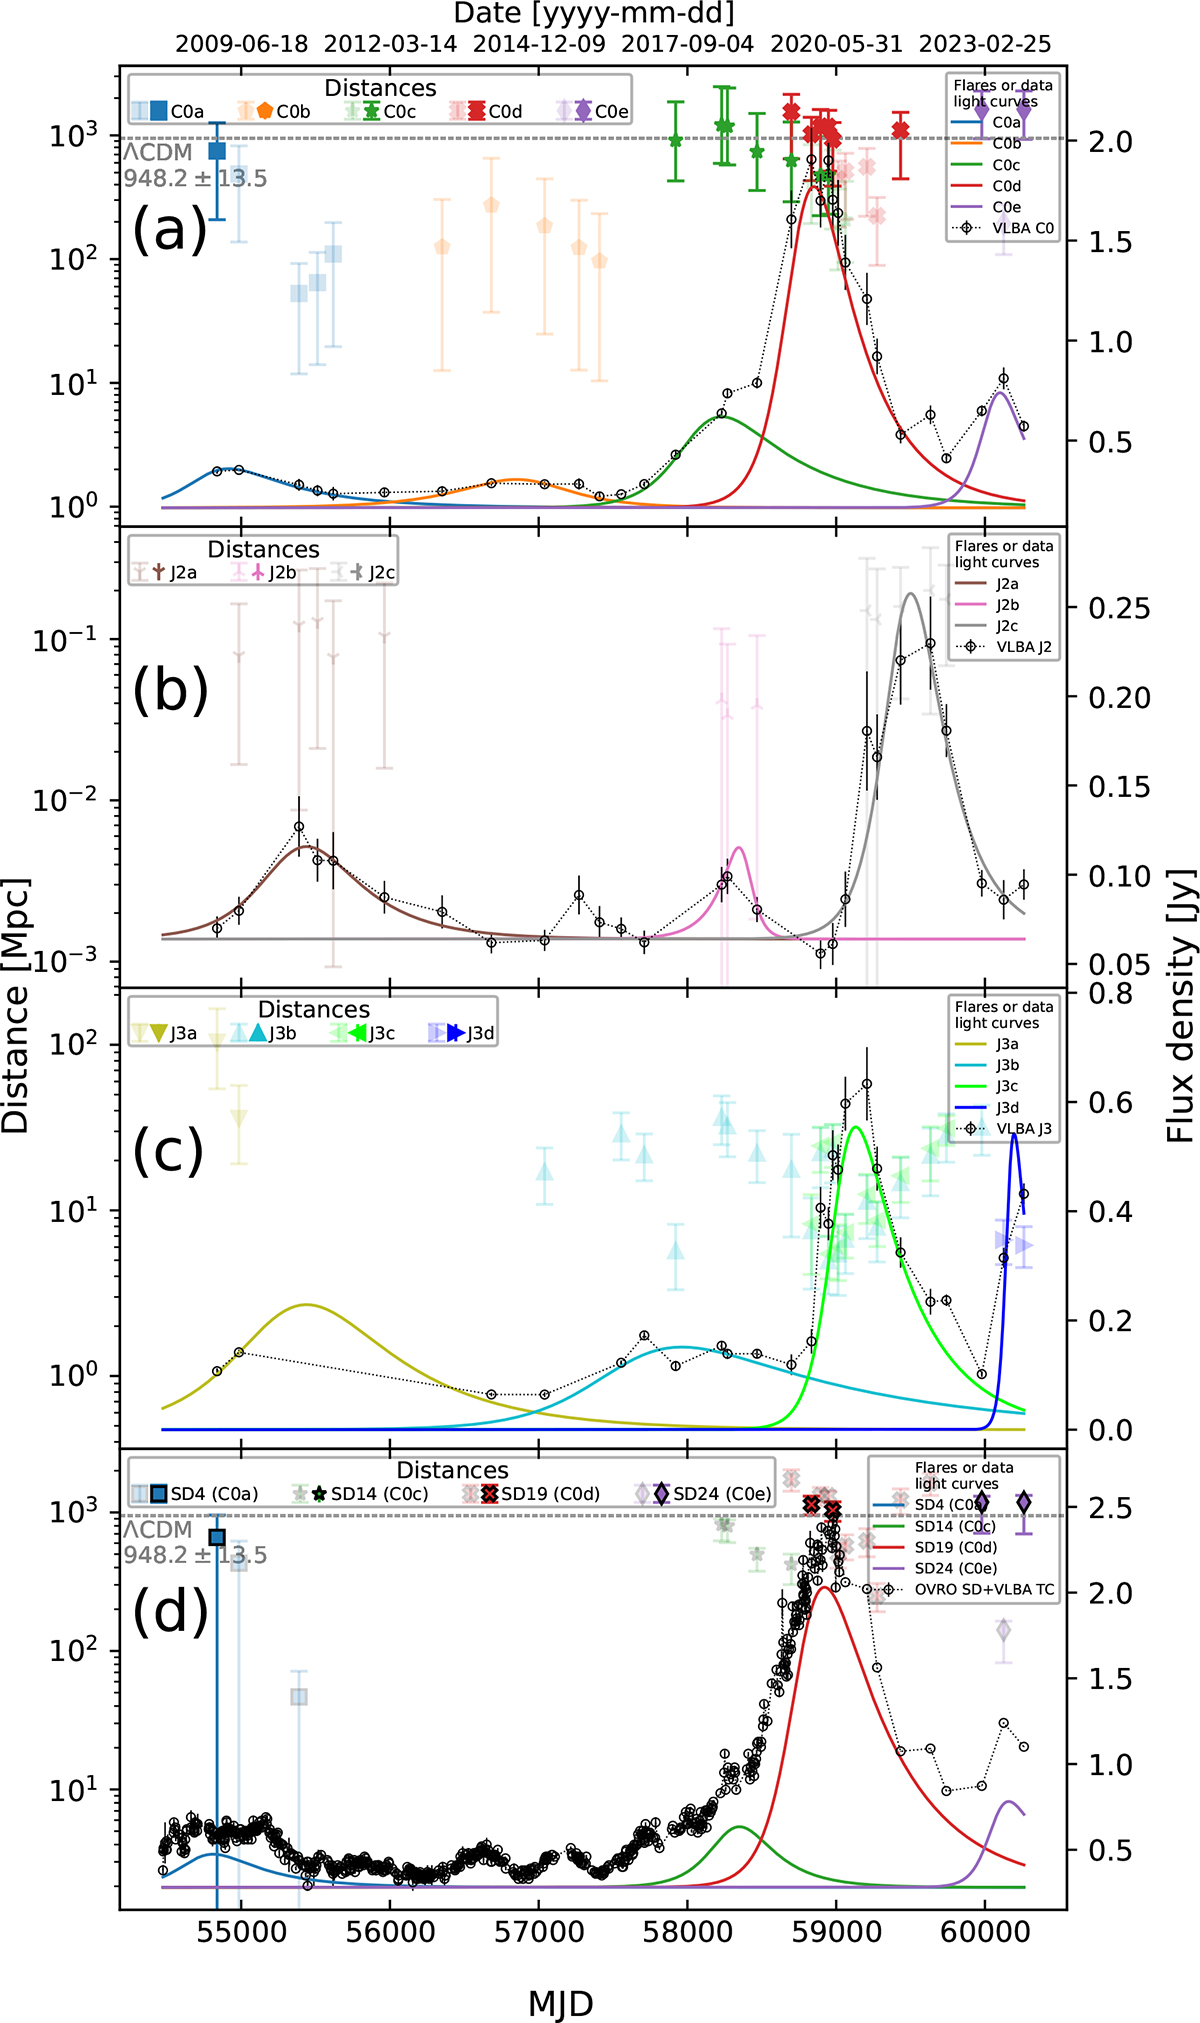
Fig. 5.
Download original image
Distance estimates of VLBA C0, J2, J3, and OVRO SD+VLBA TC (from panels (a) to (d)). The solid colored lines show decomposed flares, the colored symbols show the distance estimates using timescales and peak flux densities from the individual flares in corresponding colors, and the black circles show the data (VLBA and OVRO) light curves. The horizontal dashed gray lines note the ΛCDM distance (948.2 ± 13.5 Mpc) with 1σ uncertainty. The color symbols of the distance estimates are opaque when the distance measurements are consistent with the ΛCDM distance within 1σ uncertainties, and they are transparent when the distances are not.
Current usage metrics show cumulative count of Article Views (full-text article views including HTML views, PDF and ePub downloads, according to the available data) and Abstracts Views on Vision4Press platform.
Data correspond to usage on the plateform after 2015. The current usage metrics is available 48-96 hours after online publication and is updated daily on week days.
Initial download of the metrics may take a while.