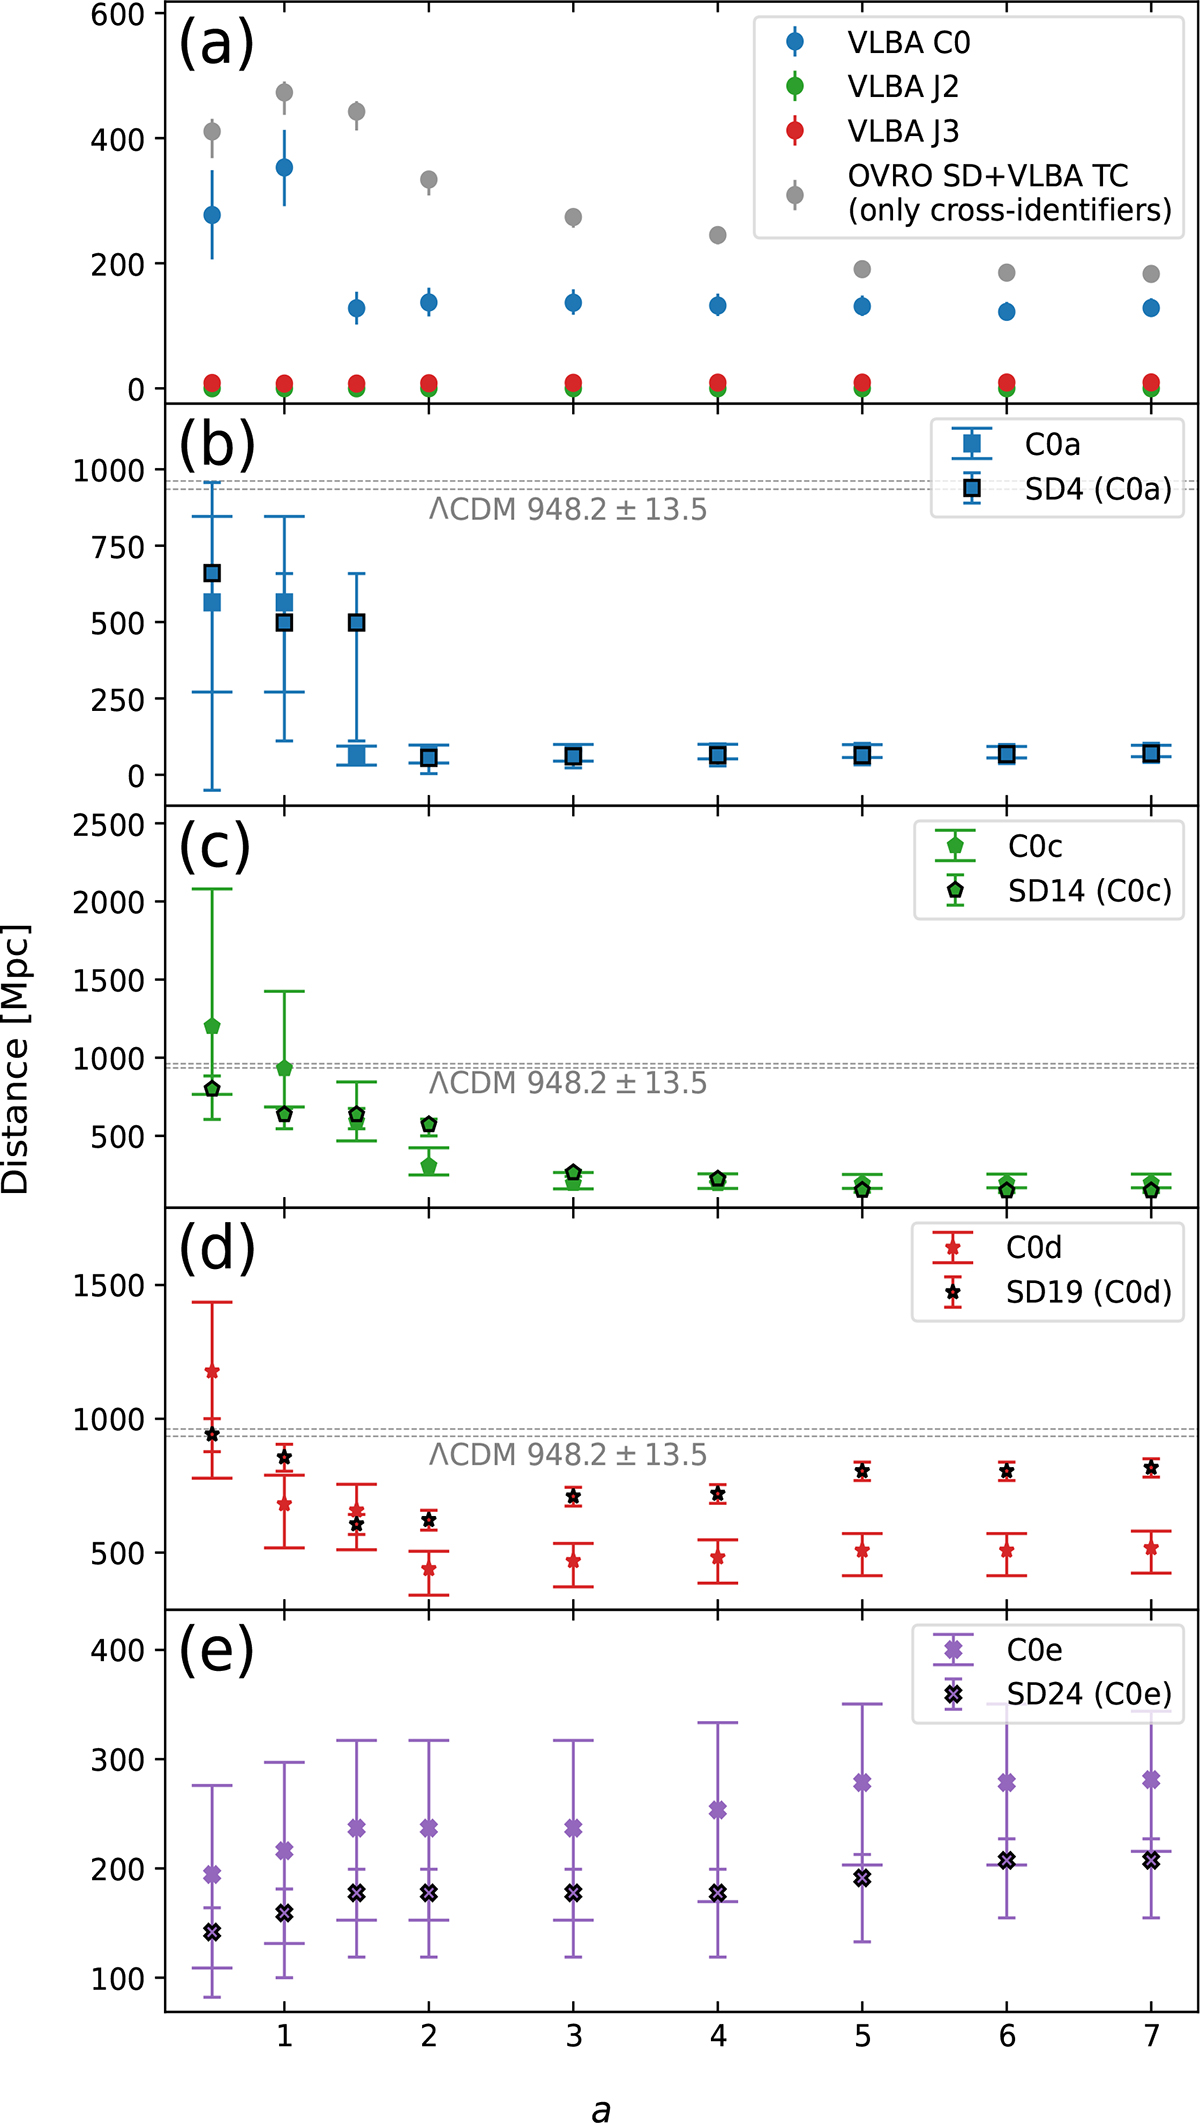
Fig. 7.
Download original image
Weighted mean of distances. The distances were calculated using the timescales and peak flux densities of each flare (C0a, C0b, C0c, C0d, C0e, J2a, J2b, J2c, J3a, J3b, J3c, and J3d) and the angular sizes of the corresponding individual components (VLBA C0, J2, and J3) obtained in the time from t0 − aτ to t0 + asτ. Panel (a) shows the weighted means of all distances estimated for VLBA C0 (blue circles), J2 (green circles), J3 (red circles), and OVRO SD+VLBA TC (gray circles). The other panels (b)–(e) show the weighted mean distances of C0a (blue squares), C0c (green pentagons), C0d (red stars), and C0e (purple crosses), respectively, with the weighted mean distances for the corresponding cross-identifiers (black outlined symbols). The horizontal dashed gray lines show the ΛCDM distance (948.2 ± 13.5 Mpc) with the 1σ uncertainty.
Current usage metrics show cumulative count of Article Views (full-text article views including HTML views, PDF and ePub downloads, according to the available data) and Abstracts Views on Vision4Press platform.
Data correspond to usage on the plateform after 2015. The current usage metrics is available 48-96 hours after online publication and is updated daily on week days.
Initial download of the metrics may take a while.