Fig. A.1.
Download original image
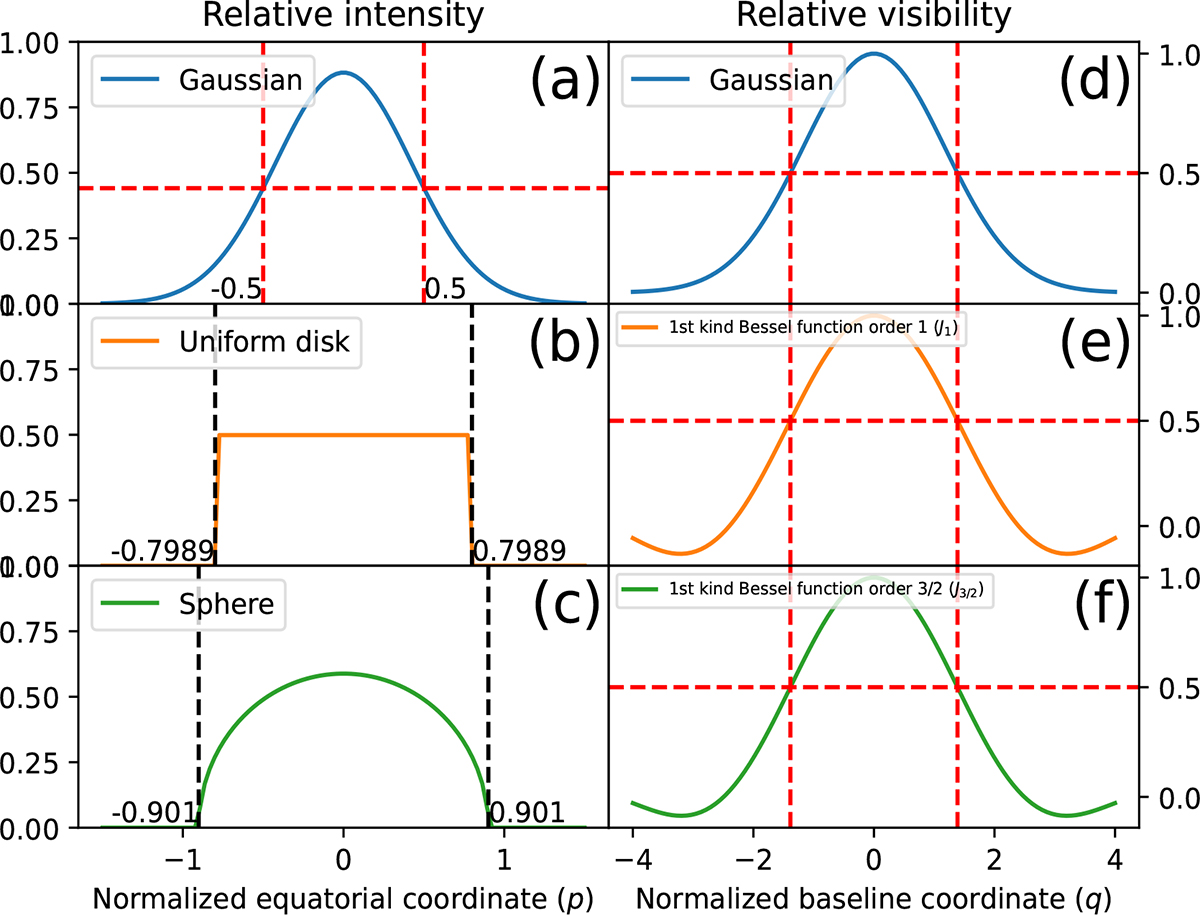
Theoretical visibility distributions (right panels from (d) to (f)) corresponding to intensity distributions (left penels from (a) to (c)). Red dashed lines denote FWHM and black dashed lines denote radius. Blue (panels (a) and (d)), orange (panels (b) and (e)), and green (panels (c) and (f)) solid lines mean Gaussian, uniform disk, and sphere intensity distributions, respectively. All visibility distributions show the same FWHMs.
Current usage metrics show cumulative count of Article Views (full-text article views including HTML views, PDF and ePub downloads, according to the available data) and Abstracts Views on Vision4Press platform.
Data correspond to usage on the plateform after 2015. The current usage metrics is available 48-96 hours after online publication and is updated daily on week days.
Initial download of the metrics may take a while.