Fig. 10.
Download original image
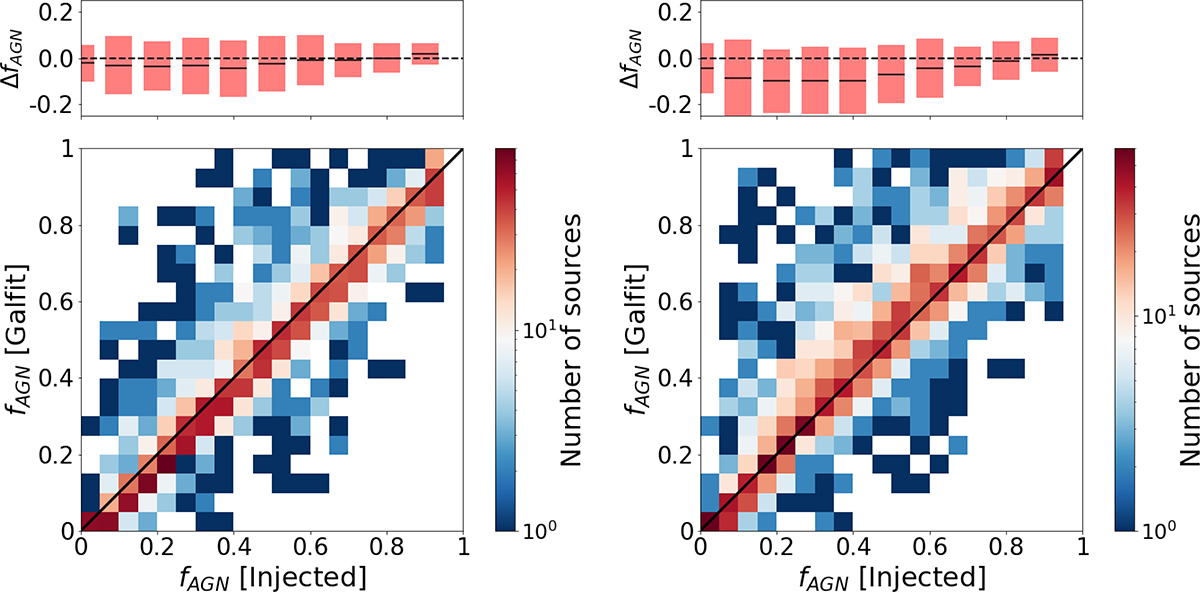
Comparison between the real injected AGN contribution fraction and the AGN contribution fraction obtained from GALFIT fitting, obtained by dividing the PSF flux by the total flux. Left: Total flux corresponds to the flux measured within a 2″aperture in the original image. Right: Flux measured within a 2″aperture in the model (Sérsic+PSF). In both cases, the PSF flux was measured within the same aperture in the model PSF image. The dispersion in the left panel corresponds to RMSE = 0.12, and in the right, RMSE = 0.17. The colour bar provides the number of sources in each 2D bin.
Current usage metrics show cumulative count of Article Views (full-text article views including HTML views, PDF and ePub downloads, according to the available data) and Abstracts Views on Vision4Press platform.
Data correspond to usage on the plateform after 2015. The current usage metrics is available 48-96 hours after online publication and is updated daily on week days.
Initial download of the metrics may take a while.