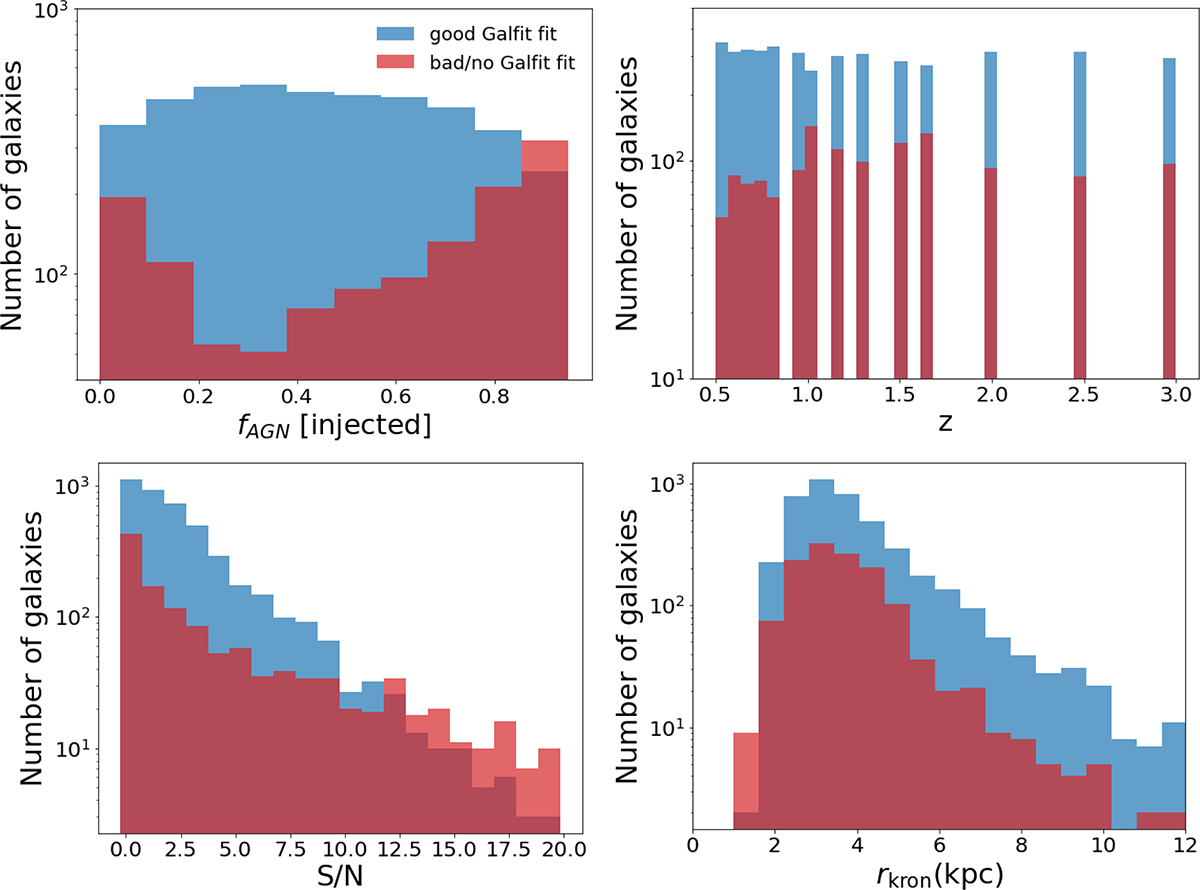
Fig. 11.
Download original image
Number of galaxies for which GALFIT returns a good fit (blue histograms) and for which there is a bad fit or no fit from GALFIT (red histograms), as a function of the injected AGN contribution fraction (top left), redshift (top right), S/N (bottom left), and rkron (bottom right). GALFIT tends to fail for bright galaxies, galaxies with low S/N, or with very high or low injected AGN contribution fractions.
Current usage metrics show cumulative count of Article Views (full-text article views including HTML views, PDF and ePub downloads, according to the available data) and Abstracts Views on Vision4Press platform.
Data correspond to usage on the plateform after 2015. The current usage metrics is available 48-96 hours after online publication and is updated daily on week days.
Initial download of the metrics may take a while.