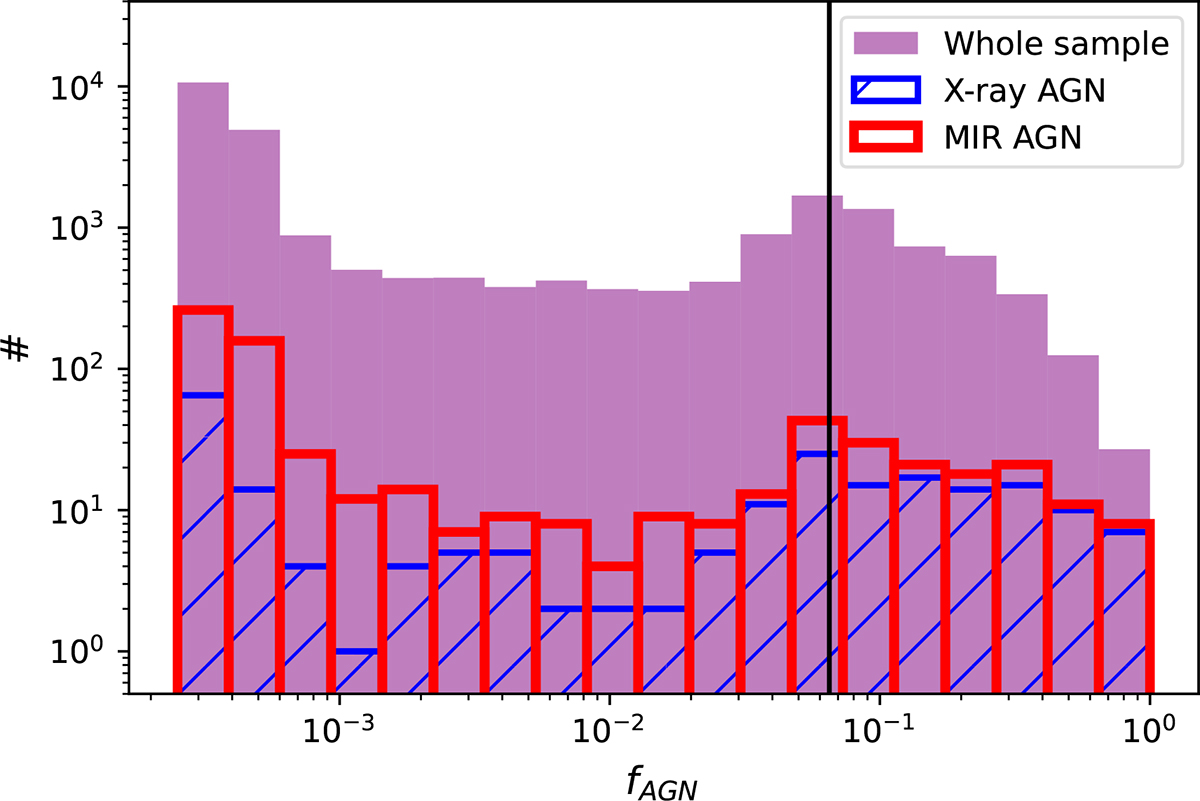
Fig. 12.
Download original image
Distribution of the predicted fAGN on the sample of JWST galaxies (purple). The blue and red histograms show the predictions for the X-ray and MIR AGNs within our sample, respectively. The black line (fAGN = 0.065) represents the 5σ value with respect to the overall mean RMSE. The x and y axes are displayed on a logarithmic scale.
Current usage metrics show cumulative count of Article Views (full-text article views including HTML views, PDF and ePub downloads, according to the available data) and Abstracts Views on Vision4Press platform.
Data correspond to usage on the plateform after 2015. The current usage metrics is available 48-96 hours after online publication and is updated daily on week days.
Initial download of the metrics may take a while.