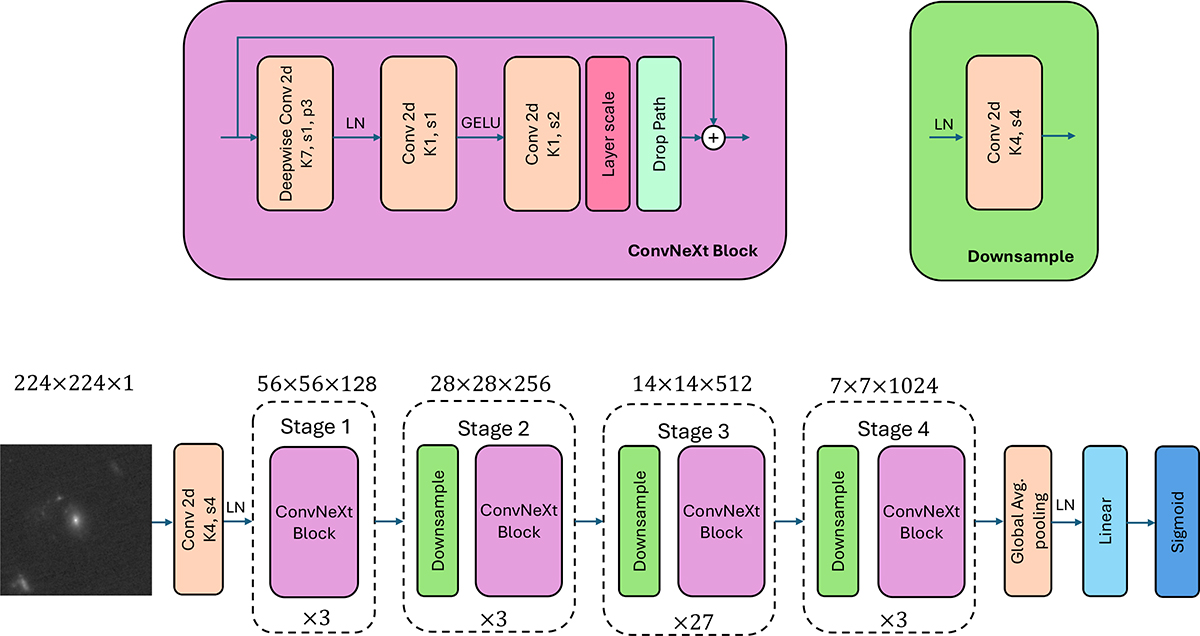
Fig. 3.
Download original image
Architecture of ConvNeXt-Base network (bottom) with a four-stage feature hierarchy, which allows us to extract features on different scales. On top of each stage, we show the dimension of the feature maps, with the width and height decreasing as the network deepens, while the filter size increases. The top left diagram shows the internal structure of ConvNeXt Block. The top right diagram shows the internal structure of Downsample. The LN and GELU represent a layer normalisation and a Gaussian error linear unit activation function, respectively.
Current usage metrics show cumulative count of Article Views (full-text article views including HTML views, PDF and ePub downloads, according to the available data) and Abstracts Views on Vision4Press platform.
Data correspond to usage on the plateform after 2015. The current usage metrics is available 48-96 hours after online publication and is updated daily on week days.
Initial download of the metrics may take a while.