Fig. 6.
Download original image
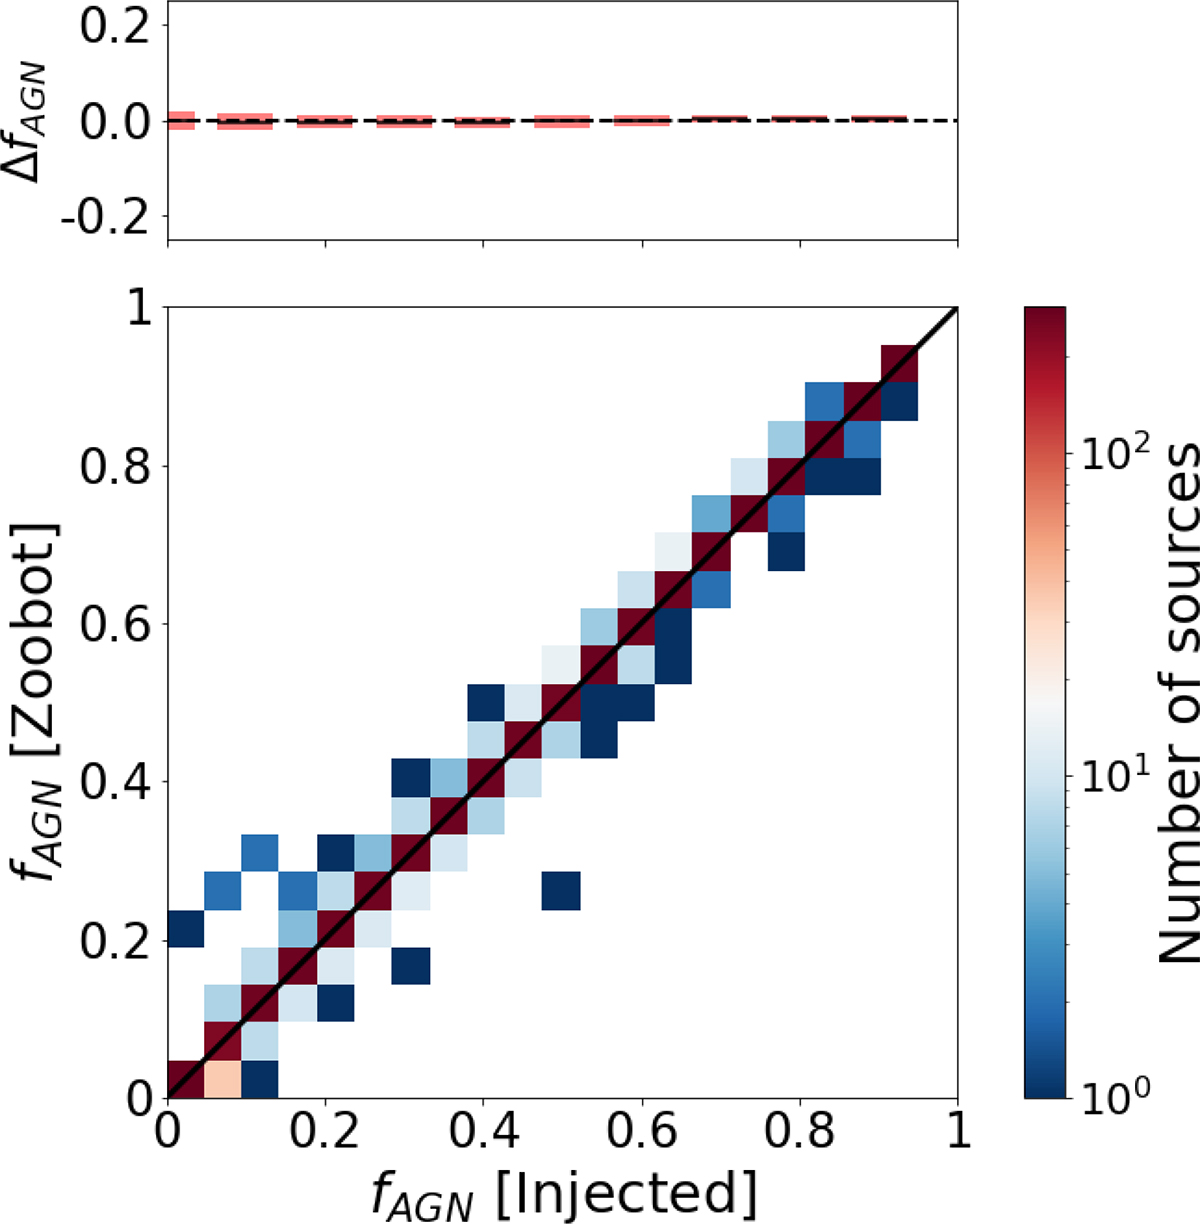
Comparison between the real injected AGN contribution fraction and the AGN contribution fraction obtained from the Zoobot model on the subset of 4800 galaxies across the whole redshift range (0.5 < z < 3). The comparison shows a mean difference between the two quantities (ΔfAGN = fAGN [Injected] −fAGN [Zoobot]) of −0.0018 and an overall RMSE = 0.013. The solid diagonal line is the 1:1 line. The top plot shows the mean difference and its dispersion as a function of the injected AGN contribution fraction. The colour bar indicates the number of sources in each bin.
Current usage metrics show cumulative count of Article Views (full-text article views including HTML views, PDF and ePub downloads, according to the available data) and Abstracts Views on Vision4Press platform.
Data correspond to usage on the plateform after 2015. The current usage metrics is available 48-96 hours after online publication and is updated daily on week days.
Initial download of the metrics may take a while.