Fig. 7.
Download original image
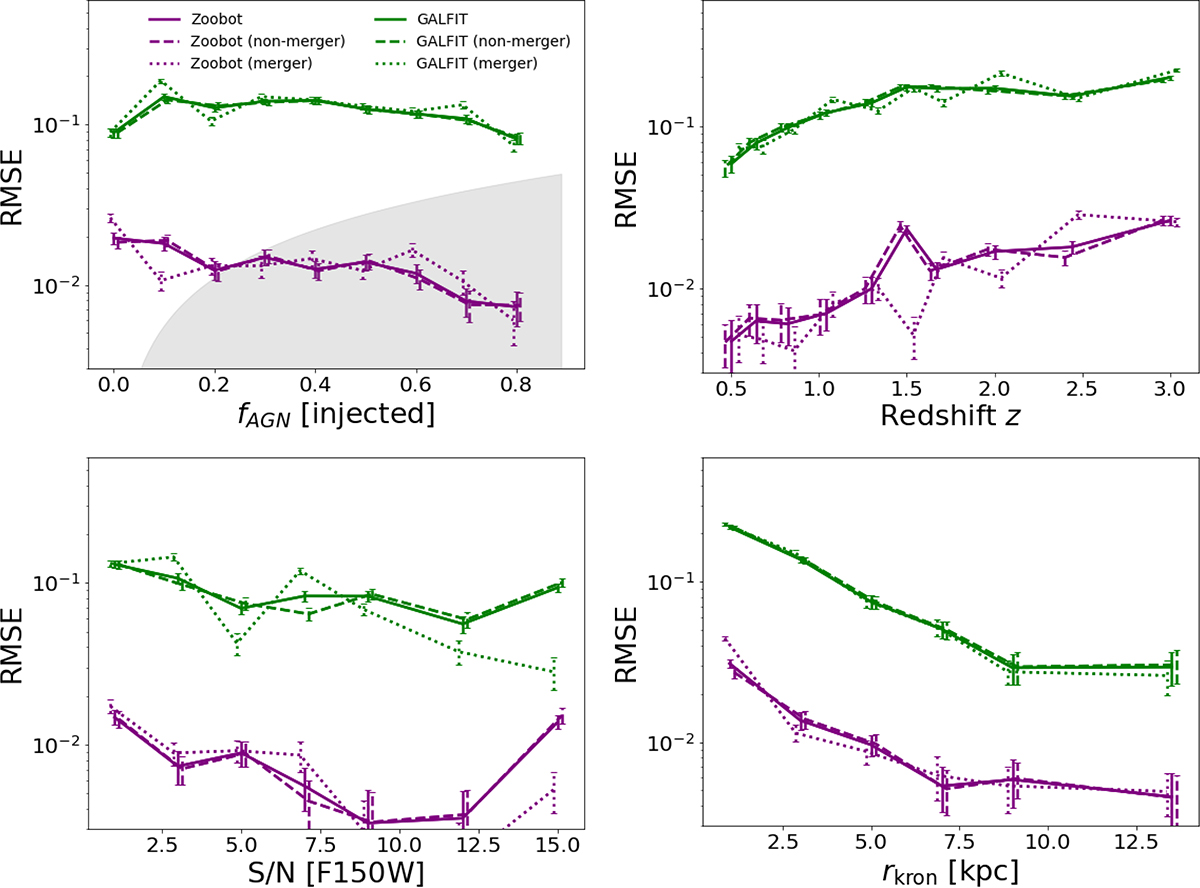
RMSE as a function of the injected AGN contribution fraction (top left), redshift (top right), S/N (bottom left), and rkron (bottom right). The purple lines correspond to the results from Zoobot, and the green lines from GALFIT. The solid lines correspond to the whole sample, while the dashed and dotted lines correspond to the mergers and non-merger galaxies, respectively. The error bars show the 95% interval from bootstrapping the RMSE value. The performance of Zoobot is around a factor of ten better than GALFIT. The shaded region in the top left panel represents the fractional variation (standard deviation divided by the mean) of the PSF, considering the spatial and temporal variations.
Current usage metrics show cumulative count of Article Views (full-text article views including HTML views, PDF and ePub downloads, according to the available data) and Abstracts Views on Vision4Press platform.
Data correspond to usage on the plateform after 2015. The current usage metrics is available 48-96 hours after online publication and is updated daily on week days.
Initial download of the metrics may take a while.