Open Access
Fig. 2.
Download original image
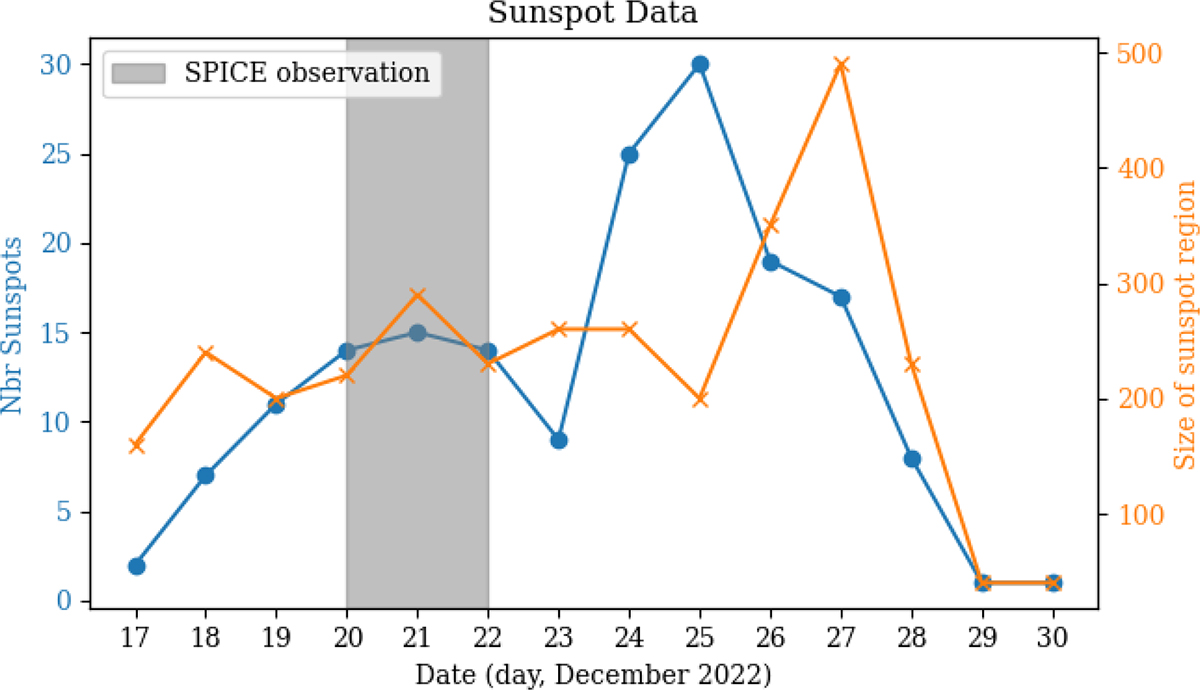
Evolution of AR 13169 in terms of sunspot number (blue curve) and sunspot area (orange curve). Data are the courtesy of https://www.spaceweatherlive.com. During this period, three M-class flares and 61 C-class flares were recorded. Observation times studied here are highlighted in gray.
Current usage metrics show cumulative count of Article Views (full-text article views including HTML views, PDF and ePub downloads, according to the available data) and Abstracts Views on Vision4Press platform.
Data correspond to usage on the plateform after 2015. The current usage metrics is available 48-96 hours after online publication and is updated daily on week days.
Initial download of the metrics may take a while.