Fig. 3.
Download original image
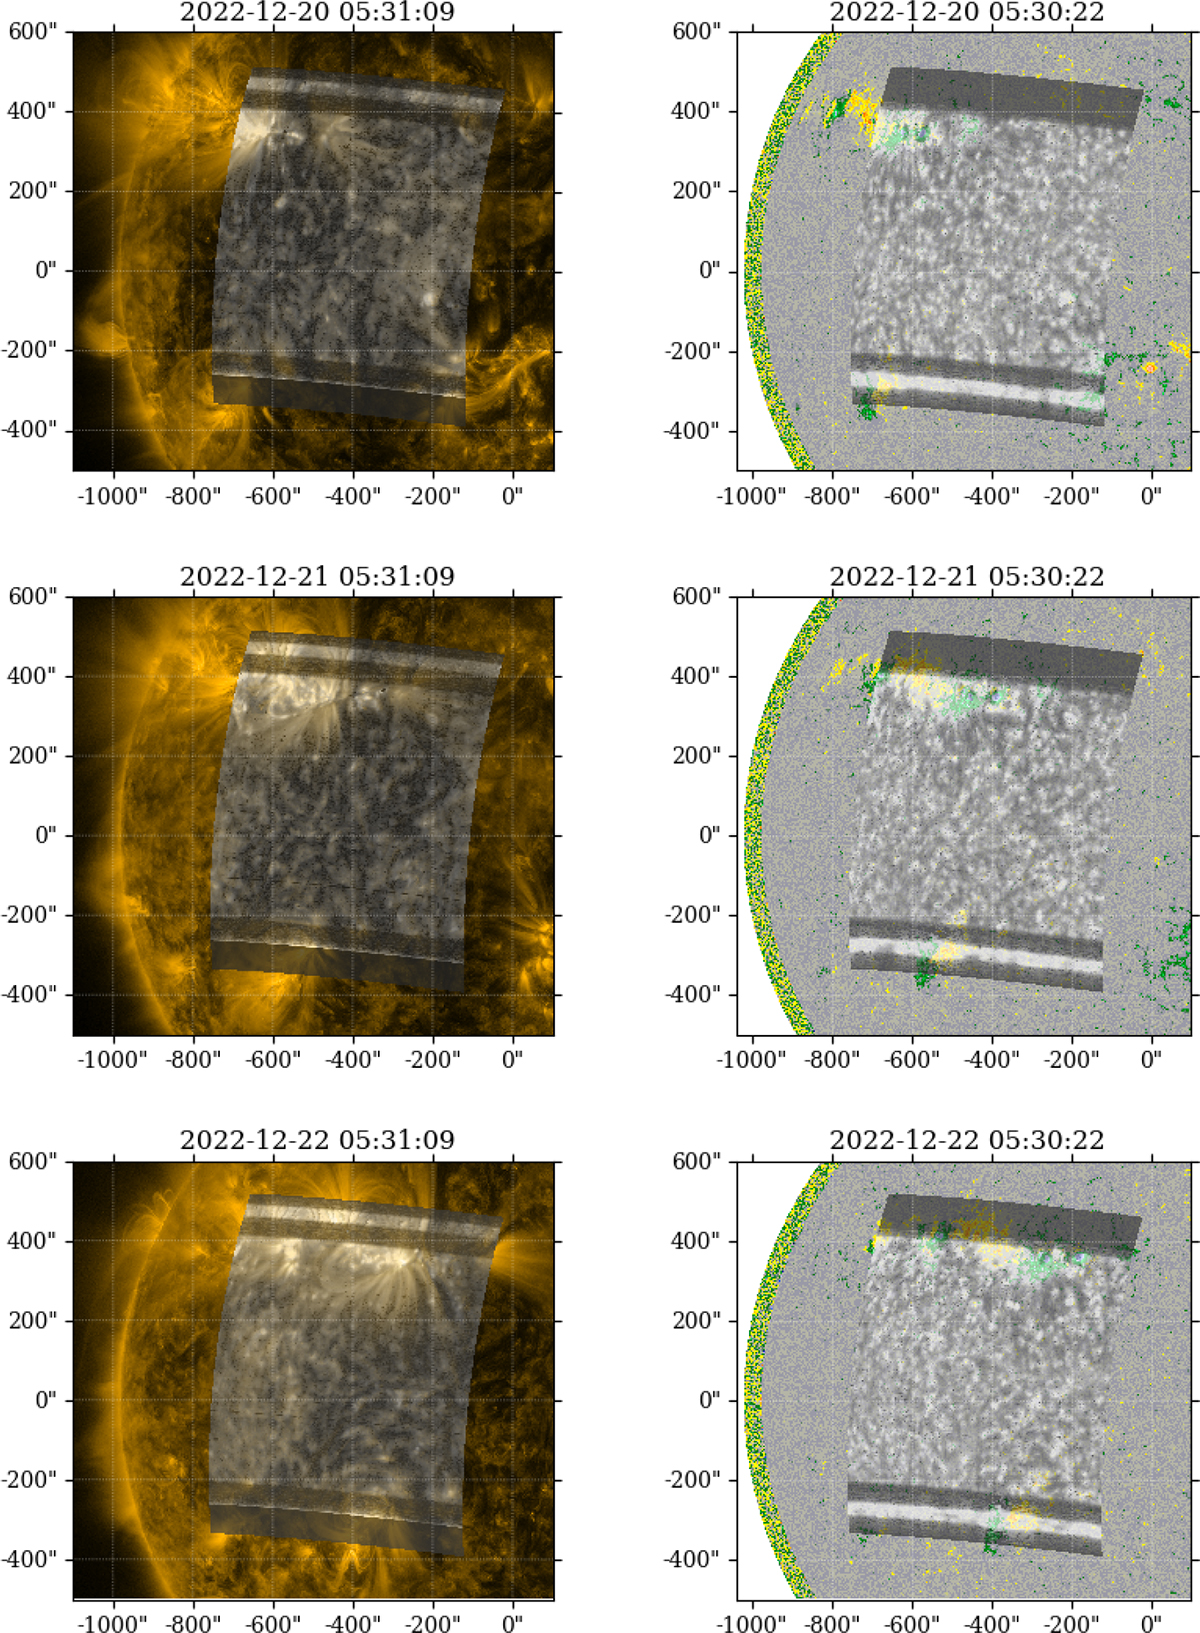
Evolution of AR 13169 (top left in the first raster) from December 20–22, 2022. Left: SPICE Ne VIII 770 Å rasters overlaid on SDO/AIA 171 Å. Right: Corresponding SDO/HMI magnetograms with C III 977 Å rasters. On the magnetograms, green/(yellow) areas represent positive/(negative) polarity. Note: The dark horizontal lines (“dumbbells”) are square alignment apertures, located at each end of the slits.
Current usage metrics show cumulative count of Article Views (full-text article views including HTML views, PDF and ePub downloads, according to the available data) and Abstracts Views on Vision4Press platform.
Data correspond to usage on the plateform after 2015. The current usage metrics is available 48-96 hours after online publication and is updated daily on week days.
Initial download of the metrics may take a while.