Fig. 4.
Download original image
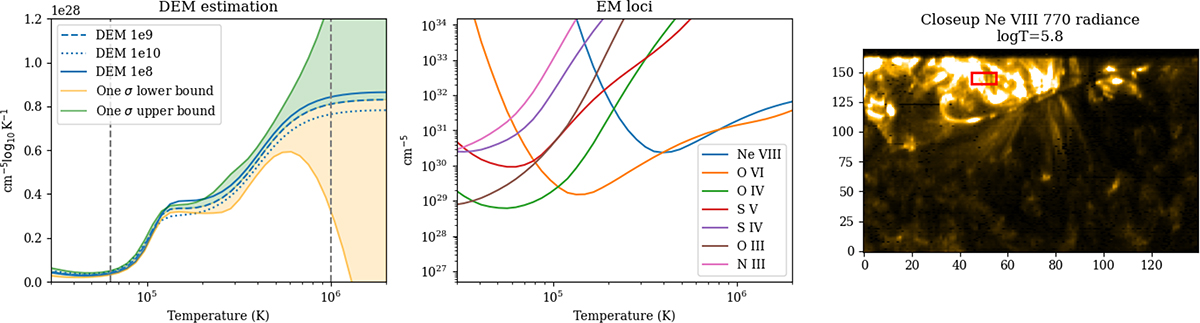
DEM estimation (left panel), EM loci (middle panel; providing an upper-limit estimate of the DEM) and corresponding zone on the Ne VIII 770 Å map. The DEM estimation indicates a rather multi-thermal emission. The dotted gray lines indicate the range of temperature where the DEM estimation is reliable, and the different line styles represent different densities. Note: The scale for the DEM is linear.
Current usage metrics show cumulative count of Article Views (full-text article views including HTML views, PDF and ePub downloads, according to the available data) and Abstracts Views on Vision4Press platform.
Data correspond to usage on the plateform after 2015. The current usage metrics is available 48-96 hours after online publication and is updated daily on week days.
Initial download of the metrics may take a while.