Fig. 5.
Download original image
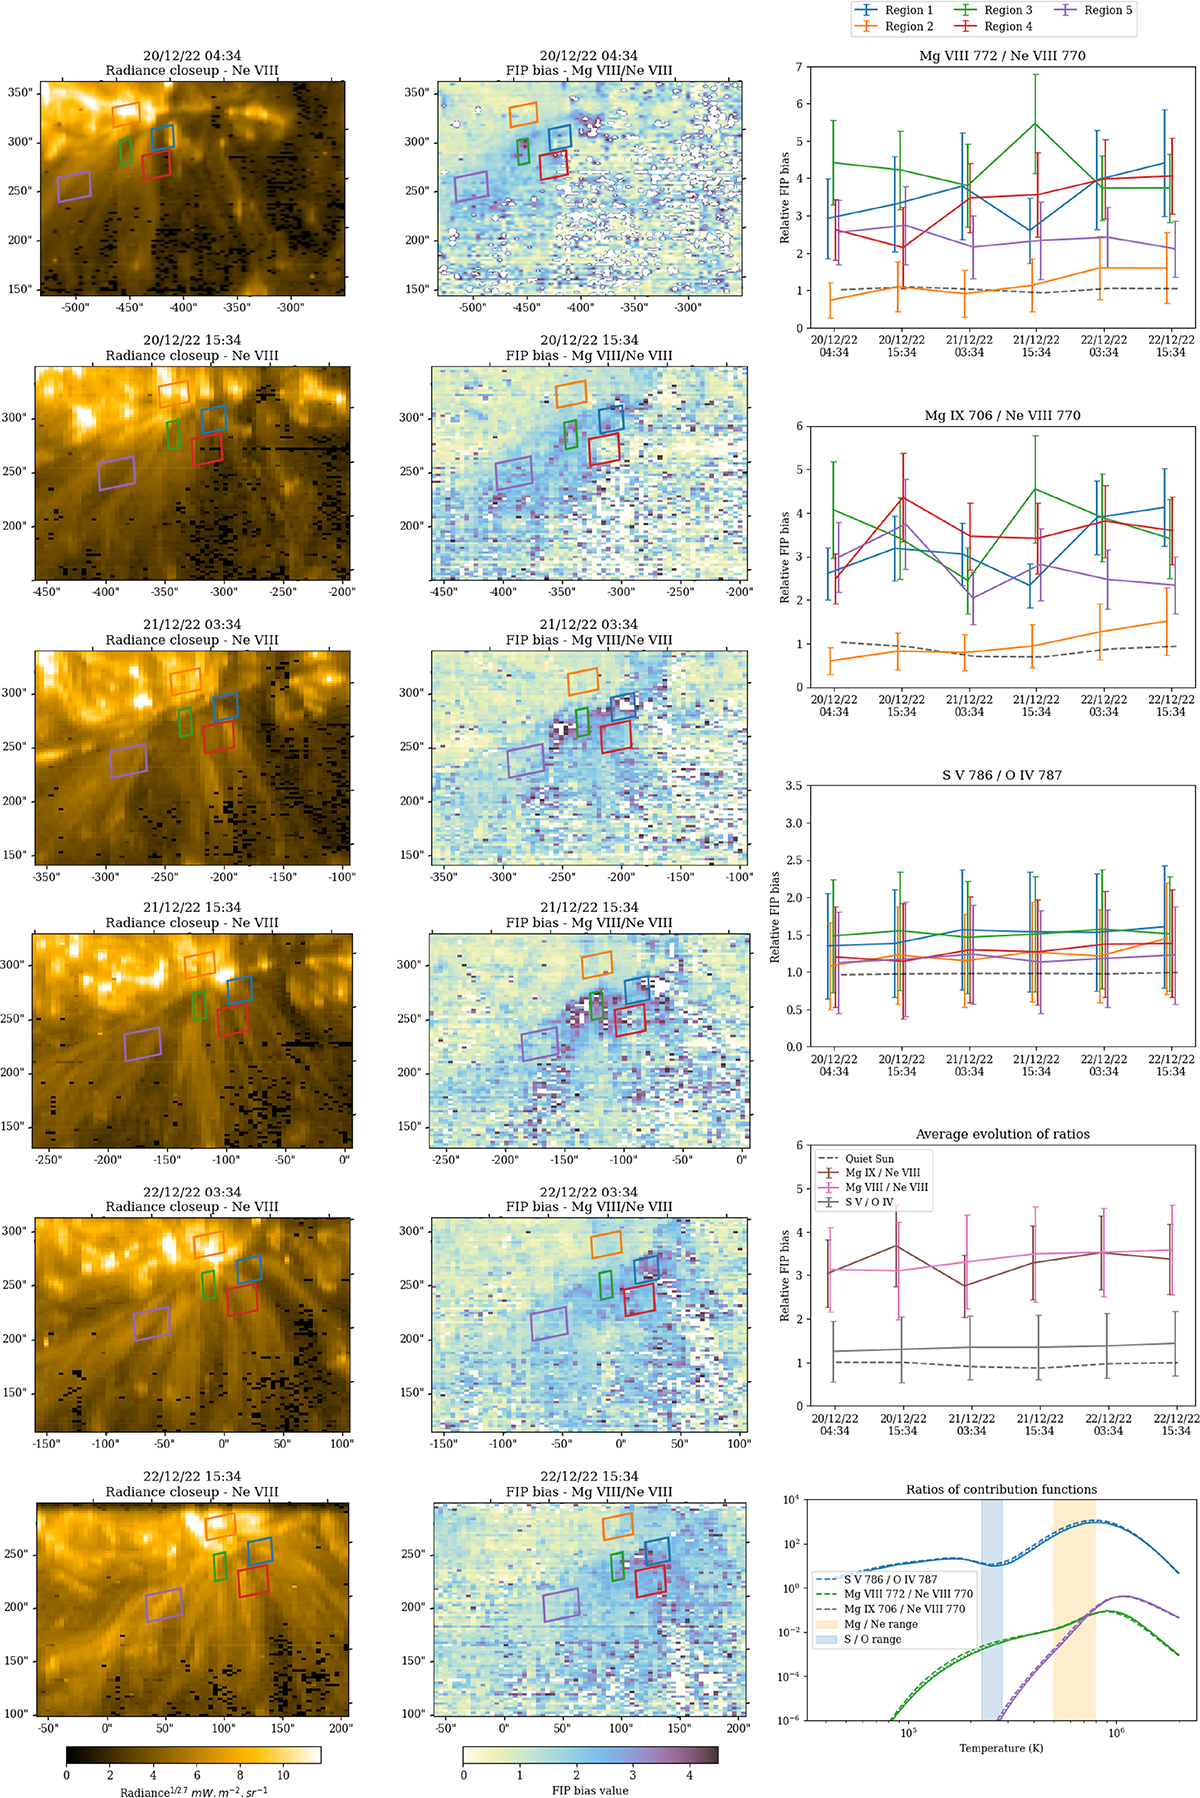
Evolution of AR 13169 with time progressing downward. Left column: SPICE radiance maps seen in the Ne VIII 770 line ![]() . Middle column: Corresponding FIP bias maps seen in the Mg IX/Ne VIII ratio. Right column: Evolution of the FIP bias values, tracking different zones. Note: Time progresses from left to right in the plots of this column, and the offset is used to show error bars more clearly. The dotted black line represents the quiet Sun reference. Bottom right: Ratio of contribution functions for the lines presented. The solid lines represent calculations with a density of ne = 108 cm−3, the dotted lines with ne = 109 cm−3 and the dashed lines with ne = 1010 cm−3.
. Middle column: Corresponding FIP bias maps seen in the Mg IX/Ne VIII ratio. Right column: Evolution of the FIP bias values, tracking different zones. Note: Time progresses from left to right in the plots of this column, and the offset is used to show error bars more clearly. The dotted black line represents the quiet Sun reference. Bottom right: Ratio of contribution functions for the lines presented. The solid lines represent calculations with a density of ne = 108 cm−3, the dotted lines with ne = 109 cm−3 and the dashed lines with ne = 1010 cm−3.
Current usage metrics show cumulative count of Article Views (full-text article views including HTML views, PDF and ePub downloads, according to the available data) and Abstracts Views on Vision4Press platform.
Data correspond to usage on the plateform after 2015. The current usage metrics is available 48-96 hours after online publication and is updated daily on week days.
Initial download of the metrics may take a while.