Fig. A.1.
Download original image
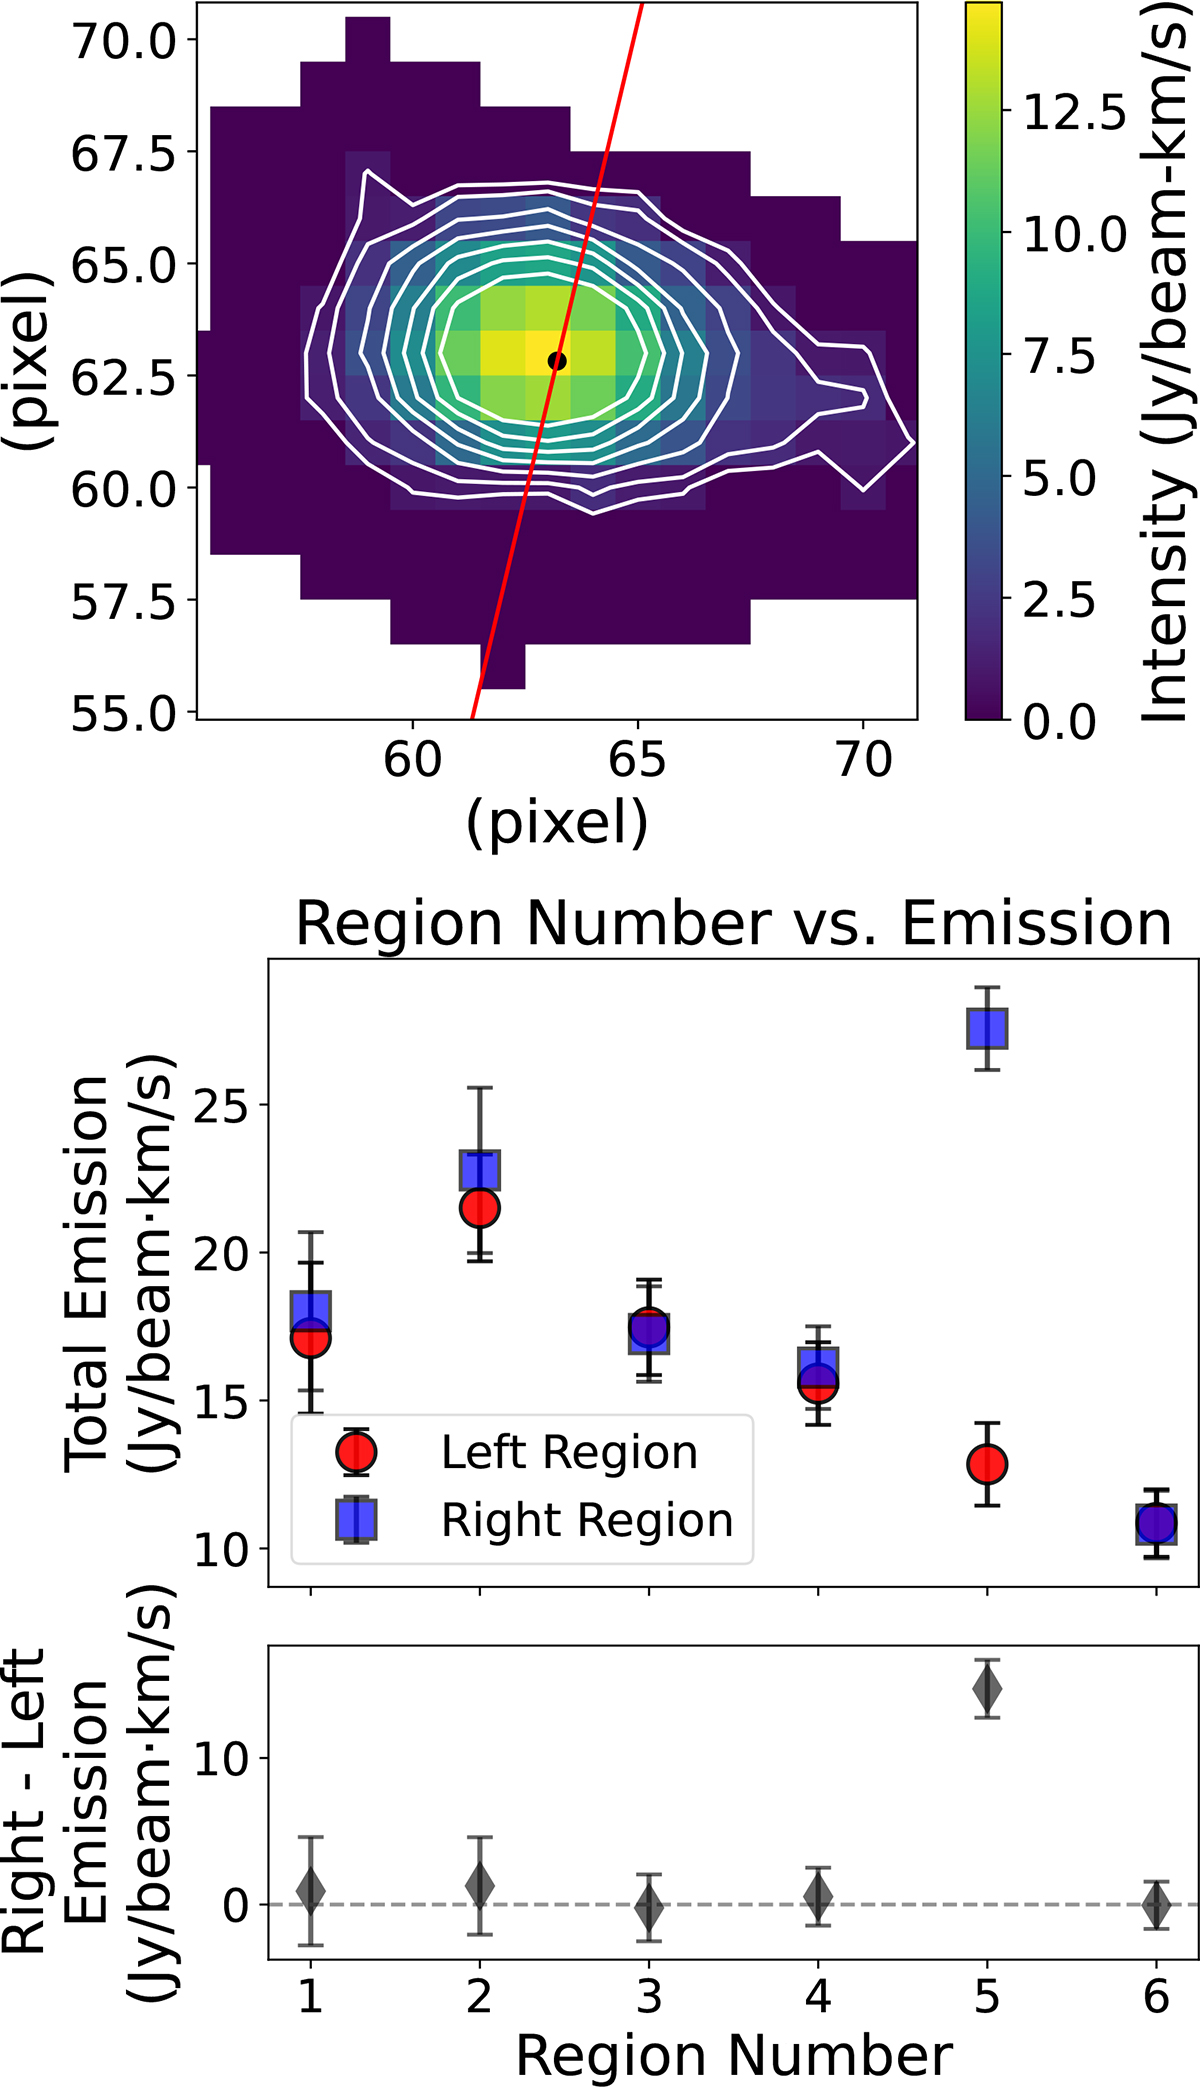
Measuring the asymmetry of the molecular hydrogen disk. Panel (a): 12CO moment zero map of the galaxy. The white contours represent surface brightness levels of (1, 2, 4, 6, 8, 10, 12)Jy/beam-km/s. The red line indicates the position angle of the galaxy and bisects each region, defined between two successive contours, into left and right halves. The corresponding total emission measured separately from each half as a function of region number is presented in panel (b). Top of panel (b): Total emission from the left and right halves of the galaxy plotted for each successive region between two contours. Region 1 corresponds to the area within the innermost contour. Subsequent regions (Region 2, 3, 4, etc) are defined between successive contours, moving outwards. Bottom of panel (b): Difference in total emission between the right and left halves (right – left) for each region. The horizontal dashed line marks zero difference, serving as a reference to illustrate the asymmetry of the two halves.
Current usage metrics show cumulative count of Article Views (full-text article views including HTML views, PDF and ePub downloads, according to the available data) and Abstracts Views on Vision4Press platform.
Data correspond to usage on the plateform after 2015. The current usage metrics is available 48-96 hours after online publication and is updated daily on week days.
Initial download of the metrics may take a while.