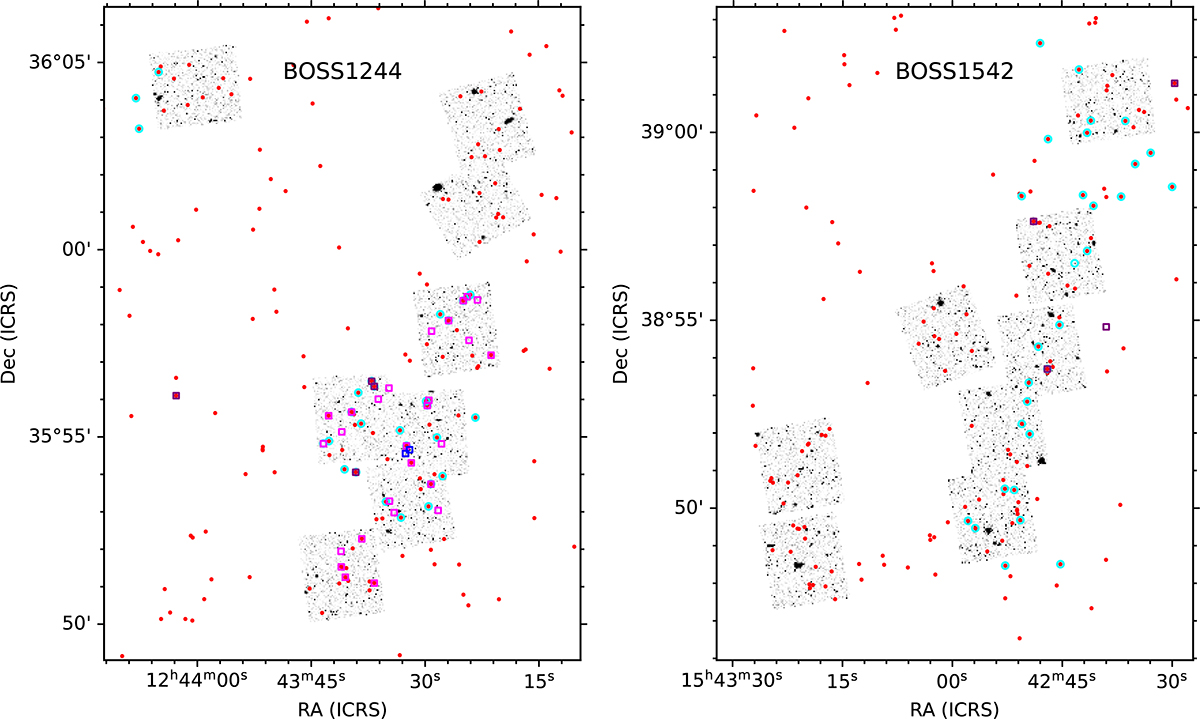
Fig. 1.
Download original image
Coverage by the HST pointings of the MAMMOTH protoclusters, BOSS1244 (left) and BOSS1542 (right). In each panel we present our HST WFC3 F160W images. The overlaid circular red regions denote the HAEs. The overlaid circular cyan regions denote HAEs that were spectroscopically confirmed by Shi et al. (2021) and fall within the larger HST footprint (a few lie beyond the coverage region). In the left panel, the galaxies that were spectroscopically confirmed via HST grism observations are overlaid as magenta squares. Similarly, the quiescent galaxies identified by Shi et al. (2024) are shown as blue squares. In BOSS1244 and BOSS1542, the SDSS-identified coeval quasars in each field are shown as purple squares. Some of these quasars were previously identified as HAEs. In BOSS1244 and BOSS1542, the densest regions are found in the lower right quadrant with HST coverage. The total area shown for BOSS1244 and BOSS1542 is ∼12′ × 17′.
Current usage metrics show cumulative count of Article Views (full-text article views including HTML views, PDF and ePub downloads, according to the available data) and Abstracts Views on Vision4Press platform.
Data correspond to usage on the plateform after 2015. The current usage metrics is available 48-96 hours after online publication and is updated daily on week days.
Initial download of the metrics may take a while.