| Issue |
A&A
Volume 706, February 2026
|
|
|---|---|---|
| Article Number | A147 | |
| Number of page(s) | 20 | |
| Section | Extragalactic astronomy | |
| DOI | https://doi.org/10.1051/0004-6361/202554357 | |
| Published online | 06 February 2026 | |
Probing the effect of the protocluster environment on galaxy morphology at z = 2.23
1
INAF – Osservatorio Astronomico di Padova Vicolo Osservatorio 5 35122 Padova, Italy
2
Department of Astronomy, Tsinghua University Beijing 100084, China
3
Center for Fundamental Physics, School of Mechanics and Optoelectronic Physics, Anhui University of Science and Technology Huainan 232001, China
4
School of Astronomy and Space Science, University of Chinese Academy of Sciences (UCAS) Beijing 100049, China
5
National Astronomical Observatories, Chinese Academy of Sciences Beijing 100101, China
6
Institute for Frontiers in Astronomy and Astrophysics, Beijing Normal University Beijing 102206, China
7
Gemini Observatory, NSF NOIRLab 670 N. A’ohoku Place Hilo Hawai’i 96720, USA
8
Department of Physics and Astronomy, University of California, Davis One Shields Ave. Davis CA 95616, USA
9
European Southern Observatory Alonso de Córdova 3107 Vitacura Santiago de Chile, Chile
10
Department of Physics and Astronomy, Texas A&M University College Station TX 77843-4242, USA
11
George P. and Cynthia Woods Mitchell Institute for Fundamental Physics and Astronomy, Texas A&M University College Station TX 77843-4242, USA
12
Institute for Astronomy, University of Hawai’i 2680 Woodlawn Drive Honolulu HI 96822, USA
★ Corresponding author: This email address is being protected from spambots. You need JavaScript enabled to view it.
Received:
3
March
2025
Accepted:
11
November
2025
Abstract
Context. As galaxies evolve in dense cluster and protocluster environments, they interact and quench their star formation. This gradually transforms the dominant galaxy population from star-forming galaxies to quiescent red galaxies. This transformation is identifiable by observing the galaxy colors and can also be seen in the morphological transformation of late-type galaxies into early-type galaxies, which creates the morphology-density relation observed when populations in clusters are compared to field galaxies at a given epoch. However, high-z (z > 2) galaxy morphology studies are hindered by the high angular resolution necessary to characterize the morphology.
Aims. We studied HST WFC3 F160W observations of protoclusters from the MAMMOTH survey (BOSS1244 and BOSS1542) at z ∼ 2.23 with populations of previously identified Hα emitters.
Methods. By measuring the Sérsic index of 151 Hα emitters, we searched for the early morphological transformation of high-z star-forming galaxies in these well-studied large nonvirialized protoclusters, which we think are the precursors of present-day galaxy clusters.
Results. The morphology of the populations of star-forming galaxies in protoclusters does not differ from that of their field counterparts. However, we also identified a population of clumpy potentially merging galaxies, which might increase the population of early-type galaxies within these structures. In BOSS1244, which has two previously identified massive quiescent galaxies including a brightest cluster galaxy (BCG), we additionally found an abundance of early-type galaxies near the BCG and two coeval high-z quasars.
Conclusions. Although the morphology of field and protocluster galaxies are very similar, the population of early-type star-forming galaxies surrounding the spectroscopically confirmed quiescent BCG in BOSS1244, which is not observed in BOSS1542, might indicate differences in the evolutionary state of these two coeval protoclusters. It might be a sign of an early forming cluster core in BOSS1244.
Key words: galaxies: clusters: general / galaxies: elliptical and lenticular, cD / galaxies: evolution / galaxies: high-redshift / galaxies: spiral
© The Authors 2026
 Open Access article, published by EDP Sciences, under the terms of the Creative Commons Attribution License (https://creativecommons.org/licenses/by/4.0), which permits unrestricted use, distribution, and reproduction in any medium, provided the original work is properly cited.
This article is published in open access under the Subscribe to Open model. This email address is being protected from spambots. You need JavaScript enabled to view it. to support open access publication.
1. Introduction
Galaxy clusters are gravitationally bound cosmic megacities that host large populations of galaxies and provide a unique laboratory for exploring galaxy evolution. These structures evolve with galaxy populations that mature dramatically. At low redshift, clusters are characterized by populations of red early-type elliptical galaxies and a densely clustered central region (e.g., Miller et al. 2005; Rykoff et al. 2014). At z > 2, however, most extended structures are better identified as protoclusters (the early stage in galaxy cluster formation), which are characterized by an overdensity of galaxies that are predicted to gravitationally collapse into a cluster at z = 0 (e.g., Muldrew et al. 2015; Overzier 2016; Chiang et al. 2017; Alberts & Noble 2022). These systems typically include large populations of star-forming and dusty galaxies (e.g., Kurk et al. 2004; Casey et al. 2015; Hill et al. 2020; Edward et al. 2024), which distinguishes them from their local counterparts. Unlike low-z clusters, which are more commonly dynamically relaxed, protoclusters are not virialized, extend well beyond the typical megaparsec-size scale of low-z clusters (e.g., Cucciati et al. 2014; Forrest et al. 2023; Staab et al. 2024; Shah et al. 2024), and can include clumpier substructures with multiple density peaks (e.g., Cucciati et al. 2014; Hatch et al. 2017).
While large samples of statistically robust clusters exist out to z ∼ 1.5 with well-studied galaxy populations (e.g., Gladders & Yee 2000; Miller et al. 2005; Lemaux et al. 2012; Wing & Blanton 2011; Rykoff et al. 2014; Gonzalez et al. 2019; Golden-Marx et al. 2019; Balogh et al. 2021) and well-constrained properties that link star formation quenching and the buildup of red sequence populations to denser cluster environments (e.g., Lemaux et al. 2019; Tomczak et al. 2019; Werner et al. 2022), the effect of the protocluster environment on galaxy populations is less well defined. In simulations at 2 < z < 5, protoclusters account for ∼20% of the cosmic star formation rate density (Chiang et al. 2017) and the buildup of stellar mass differs from the field due to the top-heavy population of massive galaxies (e.g., Muldrew et al. 2018). Furthermore, simulations found that protocluster galaxies at z < 3 quench and increase their stellar mass faster than their field counterparts, particularly among infalling satellite galaxies (e.g., Muldrew et al. 2015; Contini et al. 2016). Observationally, protoclusters include large populations of star-forming galaxies (e.g., Edward et al. 2024), although at cosmic noon, star-forming galaxies also appear to be the dominant population in the field (Muzzin et al. 2013), particularly among massive galaxies (e.g., Marchesini et al. 2014; Vulcani et al. 2016).
Importantly, the demographics of these protocluster galaxies and any identified properties are highly dependent on the choice of tracer (Overzier 2016; Alberts & Noble 2022). Protoclusters have been detected via searches for overdensities of line-emitting galaxies (including Lyman-α emitters [LAEs] and Hα emitters [HAEs; Kurk et al. 2004; Cai et al. 2017; Umehata et al. 2019; Zheng et al. 2021; Naufal et al. 2023]), by examining the environments of radio-loud active galactic nuclei (AGNs; Hatch et al. 2011; Wylezalek et al. 2013; Shimakawa et al. 2018b; Shen et al. 2021), and by searching for overdensities of dusty star-forming galaxies (e.g., Casey et al. 2015; Hill et al. 2020). Additionally, robust photometric and spectroscopic redshift surveys can be used to probe well-studied survey fields to identify protocluster populations (e.g., Cucciati et al. 2014; Lemaux et al. 2022; Forrest et al. 2023, 2024; Staab et al. 2024; Shah et al. 2024). Although most galaxies identified via these methods are forming stars, recent James Webb Space Telescope (JWST) observations have found additional populations of high-z quiescent galaxies in protocluster environments at 2.0 < z < 6.0 (e.g., McConachie et al. 2022; Naufal et al. 2024; Tanaka et al. 2024; Jin et al. 2024; Kiyota et al. 2025; McConachie et al. 2025).
Fundamental to protocluster and cluster science is understanding the evolution of galaxy populations. At z < 1.5, galaxy populations are typically quantified by color-magnitude diagrams, color-color diagrams, and measurements of the star formation rate (SFR) to estimate the quiescent fraction as a function of environment (e.g., Rudnick et al. 2012; Marchesini et al. 2014; Cooke et al. 2015, 2016; Cerulo et al. 2016; Nantais et al. 2016; Tomczak et al. 2019; Lemaux et al. 2019; Golden-Marx et al. 2019; Werner et al. 2022; Euclid Collaboration: Cleland et al. 2025). However, star formation quenching in cluster galaxies is not the only evolutionary transformation between cosmic noon (2 < z < 4) and the present day. The morphologies of galaxies at cosmic noon are primarily late-type, clumpy, and/or irregular (e.g., Mortlock et al. 2013; Shibuya et al. 2016; Chen et al. 2022; Kartaltepe et al. 2023; Treu et al. 2023; Ferreira et al. 2023; Jacobs et al. 2023; Shen et al. 2024; Smethurst et al. 2025), while low-z galaxies, particularly those in clusters, are populated by bulge-dominated early-type galaxies. This is fundamentally defined in the morphology-density relation, where denser structures host larger populations of early-type elliptical, S0, and lenticular galaxies (e.g., Dressler 1980; Postman et al. 2005; Vulcani et al. 2011a,b; Cappellari 2016; Vulcani et al. 2023; Euclid Collaboration: Cleland et al. 2025; Euclid Collaboration: Quilley et al. 2026). Although star formation quenching and morphological transformations are linked to the buildup of present-day cluster populations, these two processes act in different ways.
Crucially, the populations of irregular and late-type galaxies seen at cosmic noon must quench and morphologically transform into their low-z early-type counterparts by z ∼ 1.0 (e.g., Dressler 1980; Gladders & Yee 2000; Postman et al. 2005; Rudnick et al. 2012; Cooke et al. 2016; Cerulo et al. 2016, 2017; Nantais et al. 2017; Lemaux et al. 2019; Tomczak et al. 2019). It is therefore important to understand the conditions under which galaxies in dense environments begin to quench and/or transform their morphology. Particularly, we need to determine whether quenching occurs before or after the morphological transformation begins. Interestingly, the timescales of these processes appear to differ. In clusters, quenching primarily occurs among lower-mass galaxies between 1.0 < z < 1.5, as seen in the similarity in the quenched populations and the persistence of the color- and SFR-density relations (e.g., Rudnick et al. 2012; Lee-Brown et al. 2017; Lemaux et al. 2019; Tomczak et al. 2019). This implies that massive cluster galaxies quench first. Quenching occurs through a combination of processes that include strangulation, ram pressure stripping, harassment, and starvation, each of which acts on different timescales (e.g., Gunn et al. 1972; Larson et al. 1980; Balogh et al. 2000; Quilis et al. 2000). Thus, the quenching timescale evolves with the cluster dynamical timescale (1 – 3 Gyr; Foltz et al. 2018; Roberts et al. 2019), although it may be better traced by the longer cluster infall timescale (e.g., Werner et al. 2022; Kim et al. 2023).
The morphological transformation of cluster galaxies is not directly tied to the same processes, although they are linked (Correa et al. 2019). At low redshift, Sampaio et al. (2024) reported that the quenching timescale for low-mass galaxies is approximately twice the morphological transformation timescale (2.5 Gyr vs. 1.2 Gyr), which implies that they transform first. Because the low-z cluster environment is dominant, however, this may not hold among massive protocluster galaxies. At cosmic noon, the morphological transformation may be tied to compaction, where mergers or other instabilities bring existing stars and gas toward the galaxy center. This results in dense star-forming spheroidal galaxies (quenched by AGNs; e.g., Barro et al. 2013, 2017). Morphologically, this would result in early-type galaxies that are highly star-forming. In simulations, compaction begins at cosmic noon, with timescales of 0.5–1 Gyr, while quenching can occur over multiple Gigayears (Zolotov et al. 2015). Because galaxy mergers are important in compaction (e.g., Barro et al. 2013; Zolotov et al. 2015; Barro et al. 2017) and in the formation of massive quenched early-type galaxies (e.g., Toomre et al. 1977; Naab et al. 2006; De Lucia et al. 2011; Cappellari 2016; Rodriguez-Gomez et al. 2017), the merger timescale might be a better tracer. However, the merger rates depend on the protocluster mass, and these timescales are therefore variable (e.g., Liu et al. 2025). The differences in the timescales for quenching and morphological transformation allow for quenching to occur both before and/or after early morphological transformations. This indicates that it is important to characterize galaxy morphology in the early Universe.
The characterization of galaxy morphology requires high-resolution imaging. At high redshift, this can be done with space-based telescopes including the JWST, the Hubble Space Telescope (HST), or Euclid, and ground-based telescopes with adaptive optics. Regardless of the redshift, morphology studies can be done by modeling the light profile of galaxies using parametric models, including the Sérsic model (Sérsic 1963), which is a generalized version of the de Vaucouleurs profile (de Vaucouleurs 1948), where the Sérsic index, n, = 1 describes a classical spiral galaxy, and n = 4 describes a classical elliptical galaxy. Alternatively, nonparametric models of galaxy morphology measurements have been used to describe the galaxy light profiles in terms of concentration, asymmetry, and clumpiness (e.g., Lotz et al. 2004, 2006; Sazonova et al. 2020; Naufal et al. 2023).
The differences between cluster and protocluster populations make galaxy morphology a powerful tool for studying the evolution of these cosmic structures. However, the required high angular resolution for characterizing galaxy morphology limits the number of these studies at high redshift. Therefore, no consensus exists at the moment for the morphology-density relation in protoclusters and high-z clusters (z > 1.0). Chan et al. (2021) used the sample of 11 GOGREEN clusters (Balogh et al. 2021) with masses from 8 × 10¹² M⊙ < M200 < 8 × 10¹⁴ M⊙ at 1.0 < z < 1.4 to study 832 galaxies and found little difference between the morphology of star-forming cluster and field galaxies, but they detected an excess of oblate flattened quiescent cluster galaxies. Sazonova et al. (2020) analyzed four massive clusters (2 × 10¹⁴ M⊙ < M200 < 11 × 1014 M⊙) at 1.2 < z < 1.8 and found that two clusters show strong evidence of richer environments hosting more bulge-dominated galaxies. Similarly, Strazzullo et al. (2023) used five massive (M200 > 4 × 10¹⁴ M⊙) Sunyaev-Zel’dovich clusters at 1.4 < z < 1.7 and found that the majority of their quiescent galaxies were bulge dominated and lay in the densest environments (and similarly, that the majority of their star-forming galaxies were disky). Strazzullo et al. (2023) also found that the morphological parameters that characterize field and cluster quiescent galaxies are remarkably similar, which implied that the causes of quenching and the morphological transformation, at least among massive quiescent galaxies, might be similar for the protocluster environment and the field, but just more pervasive in protoclusters. Noordeh et al. (2021) used a well-studied z ∼ 2.0 cluster (M500 ∼ 6.3 ± 1.5 × 10¹³ M⊙; Mantz et al. 2018; Willis et al. 2020) and found a strong division based on galaxy color and morphology among cluster galaxies. Additionally, Strazzullo et al. (2013) found a dense proto-red sequence core of bulge-dominated galaxies in a z ∼ 2.0 cluster (M200 ∼ 5.3 × 10¹³ M⊙). Furthermore, Mei et al. (2023) and Afanasiev et al. (2023), who both used the same spectroscopically confirmed clusters/protoclusters (1013.5 M⊙ < Mhalo < 1014.5 M⊙) from the Clusters Around Radio Loud AGN (CARLA) Survey, found an abundance of bulge galaxies in all of their systems, including a z ∼ 2.8 protocluster (Mei et al. 2023), and an abundance of small protocluster galaxies relative to the field (Afanasiev et al. 2023). In contrast, Peter et al. (2007) found no evidence of any trends between morphology and environment in their study of a protocluster at z ∼ 2.3 with the HST. In total, these studies include ∼40 spectroscopically-confirmed galaxy clusters/protoclusters, which makes any result subject to cosmic variance. Importantly, only two of these systems lie at z > 2.1 (e.g., Peter et al. 2007; Mei et al. 2023), and except for Peter et al. (2007), each probed galaxy populations that included potentially quenched galaxies. Therefore, the transformation of the cluster galaxy morphology cannot be decoupled from quenching. Importantly, the majority of systems are massive, so it is impossible to determine the role of the cluster mass in the evolution of the morphology-density relation without a larger sample.
When galaxy evolution is characterized based on morphology, particularly at high redshift, it is important to account for galaxy mergers, which may affect the buildup of the morphology-density relation in high-z protoclusters because galaxy mergers are important in the formation of massive early-type galaxies. Although no consensus exists on the merger rates within protoclusters (Delahaye et al. 2017; Coogan et al. 2018; Watson et al. 2019; Monson et al. 2021; Liu et al. 2023, 2025; Giddings et al. 2026), the high density of galaxies in protoclusters allows for the possibility of mergers. Because the velocity dispersion of protocluster galaxies was measured as ∼300 km/s in simulations (Cucciati et al. 2014) and < 500 km/s in observations (e.g., Toshikawa et al. 2020; Liu et al. 2025), these properties further enhance the likelihood of galaxy interactions and indicate that mergers play a key role in protocluster galaxy evolution. Observationally, it is important to note that protoclusters not only foster galaxy mergers, but also host clumpy galaxies, the abundance of which peaks at cosmic noon (e.g., Shibuya et al. 2016; Umehata et al. 2025). As shown by Ribeiro et al. (2017), these clumpy galaxies can also result from major mergers. Because it is difficult to differentiate clumpy galaxies that are not merging from merging systems without accurate spatially resolved spectroscopy, some fraction of visually identified mergers might instead be nonmerging clumpy galaxies. While different, both populations can result in eventual galaxy transformations, and accounting for both these populations is an important question in tracing the evolution of these cluster galaxies.
Because the timescales and processes associated with quenching and the morphological transformation of protocluster galaxies differ, it is vital to determine whether star-forming protocluster galaxies experience early processing that would begin to transform their morphology before quenching. While the JWST has proven invaluable for galaxy evolution and morphology studies, in particular, at z > 2 (e.g., Kartaltepe et al. 2023; Treu et al. 2023; Shen et al. 2024; Jin et al. 2024; Lee et al. 2024; van der Wel et al. 2024; Kawinwanichakij et al. 2025; Gozaliasl et al. 2025) and regarding galaxy evolution in protoclusters (e.g., COSMOS-Web; Shuntov et al. 2025a,b; Toni et al. 2025a,b), results regarding the morphology of protocluster galaxies are still forthcoming.
To determine the role of the protocluster environment on the transformation of galaxy morphology and if this transformation occurs before or after quenching, we present new results from the MApping the Most Massive Overdensities through Hydrogen (MAMMOTH) survey (e.g., Cai et al. 2016, 2017). Specifically, we used HST observations of two protoclusters at z ∼ 2.23 (P.I. Zheng Cai). Although we only included two protoclusters, we traced star-forming galaxies in protoclusters, which allowed us to examine a very narrow but important window into the evolution of protocluster galaxies. By examining the morphology of massive star-forming galaxies, we can better determine whether the morphological transformation of star-forming galaxies is affected by the protocluster environment and if this transformation occurs prior to quenching, or if the protocluster and coeval field galaxies instead appear to be morphologically similar at cosmic noon. This would indicate that the morphological transformation of protocluster galaxies occurs after quenching has begun.
The remainder of this paper is structured as follows. We introduce the MAMMOTH survey in Sect. 2.1 and our analysis methods in Sect. 2.2. We present and contextualize our results in Sects. 3 and 4. We adopt a flat ΛCDM cosmology, using H0 = 70 km s−1 Mpc−1, Ωm = 0.3, and ΩΛ = 0.7. Unless otherwise noted, all distances are given as proper distances, and all magnitudes are given as AB magnitudes.
2. Data
2.1. MAMMOTH protoclusters
To study the impact of the protocluster environment on galaxy morphology, we need a statistically robust sample of protocluster galaxies at z > 2.0. To this end, we used well-studied protoclusters from the MAMMOTH survey (e.g., Cai et al. 2016, 2017; Zheng et al. 2021; Shi et al. 2021; Zhang et al. 2022; Wang et al. 2022; Liu et al. 2023; Shi et al. 2024; Liu et al. 2025; Zhou et al. 2025). MAMMOTH systems were identified via strong Lyman-α absorption features in SDSS BOSS spectroscopy (e.g., Cai et al. 2016, 2017), indicating the existence of large-scale cool gas, which suggests that these structures are dynamically young (see BOSS1244 and BOSS1542 in Fig. 1 for the HST Wide Field Camera 3 [WFC3] F160W coverage of these protoclusters). Each MAMMOTH system discussed here has been shown to be a massive protocluster structure hosting large populations of high-z HAEs (e.g., Zheng et al. 2021; Shi et al. 2021).
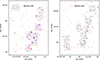 |
Fig. 1. Coverage by the HST pointings of the MAMMOTH protoclusters, BOSS1244 (left) and BOSS1542 (right). In each panel we present our HST WFC3 F160W images. The overlaid circular red regions denote the HAEs. The overlaid circular cyan regions denote HAEs that were spectroscopically confirmed by Shi et al. (2021) and fall within the larger HST footprint (a few lie beyond the coverage region). In the left panel, the galaxies that were spectroscopically confirmed via HST grism observations are overlaid as magenta squares. Similarly, the quiescent galaxies identified by Shi et al. (2024) are shown as blue squares. In BOSS1244 and BOSS1542, the SDSS-identified coeval quasars in each field are shown as purple squares. Some of these quasars were previously identified as HAEs. In BOSS1244 and BOSS1542, the densest regions are found in the lower right quadrant with HST coverage. The total area shown for BOSS1244 and BOSS1542 is ∼12′ × 17′. |
Because our MAMMOTH protocluster populations are selected via HAEs, it is important to understand any biases among this population. While robust spectroscopic surveys allow for a more uniform identification of protocluster populations down to lower masses, these surveys can be observationally expensive, particularly given the large angular extent of protoclusters, and are currently limited to well-studied survey fields (e.g., Morishita et al. 2023; Staab et al. 2024; Forrest et al. 2024; Shah et al. 2024; Forrest et al. 2025; Watson et al. 2025b). HAEs therefore offer a unique alternative to expensive spectroscopy, particularly given that photometric redshift estimates based on narrow-band selected emitting galaxies are accurate (e.g., Shi et al. 2021) and these observations require far less telescope time. In comparing samples of HAEs at z ∼ 2 to coeval star-forming galaxies, Oteo et al. (2015) found that the distribution of stellar masses and SFRs of HAEs resembled typical star-forming galaxies. Although the median HAE stellar mass and SFR is slightly above normal star-forming galaxies, HAEs only excluded the bluest and least massive typical star-forming galaxies. Additionally, Oteo et al. (2015) found that HAE estimated SFRs agreed within 0.3 dex of dust-corrected UV SFRs and that these galaxies lay on the star formation main sequence down to M* ∼ 109.5 M⊙. HAEs therefore appear to be a strong proxy for the total protocluster population, allowing us to trace a representative population of these structures.
The first protocluster in our sample is BOSS1244. Originally reported in Zheng et al. (2021), BOSS1244 is characterized by a rich population of HAEs corresponding to an overdensity of 5.6 ± 0.3σ over a 54 × 32 × 32 cMpc3 region and includes 244 HAEs (Zheng et al. 2021). Each HAE was detected via deep Ks broadband and H2S1 narrowband imaging taken with the wide-field infrared camera on the Canada-France-Hawaii Telescope (see Zheng et al. 2021 for a full description of the image reduction and HAE detection in these protoclusters). To be classified as an HAE, Zheng et al. (2021) required a minimum Hα equivalent width of 45 Å, which corresponds to ∼5.1 M⊙/yr at z ∼ 2.24, and should allow for the inclusion of the fainter end of the luminosity function for HAEs as seen in Lee et al. (2012). However, Fig. 4 shows that the majority of the SFRs for the HAEs in both protoclusters are above 20 M⊙/yr. We note that this bias in our sample limits our analysis of the morphology of protocluster galaxies to primarily bright, star-forming galaxies.
BOSS1244 was spectroscopically confirmed and shown to consist of two substructures at z = 2.230 and z = 2.246 (Shi et al. 2021; despite the separate redshift peaks, we treat BOSS1244 as one structure in this analysis). Shi et al. (2021) used the Multiple Mirror Telescope/Magellan Infrared Spectrograph (MMT/MIRS) to observe 46 target HAEs and the Large Binocular Telescope/LUCI (LBT/LUCI) near-infrared spectrograph to observe an additional 15 HAEs (as well as 3 overlapping targets). In total, 46 HAEs were confirmed to be at the target redshift, including 5 HAEs that are quasars (see Fig. 1 for the distribution of spectroscopically confirmed galaxies; see Shi et al. 2021 for a complete description of the spectroscopic sample of HAEs in BOSS1244). From these spectroscopic observations, Shi et al. (2021) measured a line-of-sight velocity dispersion of ∼400 km s−1 in each component and cluster masses of M200 = 2.8 ± 2.2 × 10¹³ M⊙ and M200 = 3.0 ± 2.0 × 10¹³ M⊙.
Furthermore, additional protocluster member galaxies were identified as part of the analysis in Shi et al. (2024), which used HST WFC3 grism slitless spectroscopy to identify two spectroscopically-confirmed quiescent galaxies, including a BCG. Beyond the two spectroscopically-confirmed quiescent galaxies, Shi et al. (2024) reported 14 additional spectroscopic members, which were not previously identified narrow-band selected HAEs (for a complete description of these HST grism observations, see Shi et al. 2024 and Wang et al. 2022). Although we focus on the sample of HAEs, we do include an additional discussion of the spectroscopic sample in Sect. 4.3.
Based on the detection of these HAEs, Zheng et al. (2021) constructed overdensity contours to trace the distribution of emitters. As reported by Zheng et al. (2021) and Shi et al. (2021), BOSS1244 shows two large density peaks, which were confirmed via the velocity distributions measured in Shi et al. (2021). Each of these density peaks shows a more concentrated distribution of galaxies, akin to the distribution of galaxies expected in a low-z relaxed galaxy cluster. Based on the velocity distribution of these HAEs and their estimated masses, Shi et al. (2021) predicted that these two components will collapse into a single cluster structure by z = 0.
For this morphology analysis, MAMMOTH also undertook a large HST campaign (P.I. Zheng Cai, Proposal ID = 15266) using the WFC3 camera in the F160W band (λo = 1536.9 nm, Δλ = 268.3 nm) to characterize the galaxy populations in BOSS1244, BOSS1542, and BOSS1441 (see Appendix A for our analysis of BOSS1441). At z ∼ 2.23, the WFC3 F160W filter is ideal for characterizing the morphology of galaxies as the majority of the optical stellar emission will be redshifted into the IR. Additionally, the full-width-half-maximum (FWHM) of the PSF in the F160W band is ∼0 151 (∼1.25 kpc at z = 2.23), which allows us to characterize the morphology of high-z galaxies. The final science images were produced using ASTRODRIZZLE with a scale of 0
 06/pixel. The limiting magnitude of these HST WFC3 F160W observations is ∼24.97 magnitudes for both fields. Because protocluster structures are much larger than the field-of-view (FOV) of HST WFC3 (2.1 × 2.3 arcmin2), the observations were designed to observe the densest regions of each protocluster, allowing us to cover the most possible HAEs (see the left panel of Fig. 1). For BOSS1244, this results in 8 WFC3 F160W pointings each with an exposure time of 2614.684 s covering 91 HAEs (see Table 1 for the breakdown of the number of emitters in each protocluster and how many are observed with HST).
Selection statistics for the protocluster sample.
The second protocluster is BOSS1542, which was spectroscopically confirmed at z = 2.241(Shi et al. 2021). BOSS1542 has an overdensity of 4.9 ± 0.3σ over the same area as BOSS1244 and includes 223 HAEs that were identified in the same manner as those in BOSS1244 (Zheng et al. 2021). BOSS1542 was similarly spectroscopically confirmed using MMT/MIRS spectroscopy to observe 23 HAEs and LBT/LUCI was used to confirm an additional 36 galaxies (Shi et al. 2021). In total, 35 galaxies were found at the target redshift, including three quasars previously identified as HAEs. From these observations, Shi et al. (2021) estimated a velocity dispersion of ∼250 km s−1 and a mass of M200 = 0.79 ± 0.31 × 10¹³ M⊙. Similar to BOSS1244, only the densest regions of the protocluster were observed with HST WFC3 F160W (see the right panel of Fig. 1), resulting in the 8 HST pointings each with an exposure time of 2614.684 s covering 92 HAEs.
As discussed by Zheng et al. (2021) and Shi et al. (2021) and explicitly seen in Fig. 1 of Shi et al. (2021), despite having similar observations and populations of HAEs, the distribution of HAEs in BOSS1542 is more elongated and filamentary, especially when compared to that of BOSS1244. Despite similar total masses, this difference in the overall protocluster morphology may hint at differences in the dynamical state of BOSS1244 and BOSS1542. That these protoclusters may be coeval, but observed at different points in their evolution could add additional uncertainty to our measurement of the morphology of protocluster galaxies as a function of environment as we are only probing two systems.
2.2. Estimating the morphology of protocluster galaxies
We estimated the morphology of protocluster galaxies using a Sérsic model (Sérsic 1963) to characterize the light profile of each galaxy. Given that the MAMMOTH protoclusters are at z ∼ 2.23, where the classical model of a spiral galaxy (n = 1) and elliptical galaxy (n = 4) does not necessarily characterize the majority of galaxies (e.g., Ferreira et al. 2023), we classified our galaxies as either early-type (n ≥ 2), or late-type (n < 2) following a similar criteria presented in literature (e.g., Strazzullo et al. 2013; Noordeh et al. 2021). We also include an additional subset of early-type galaxies, which we refer to as strongly bulge-dominated early-type galaxies (n ≥ 3) to account for the most early-type looking galaxies.
To measure the morphology of each protocluster galaxy, we used GALFIT (Peng et al. 2002, 2010a), a 2D data analysis tool that directly fits a galaxy’s light profile and measures its morphology. GALFIT works by creating a model for each galaxy, subtracting the model from the original image, and creating a residual to estimate the goodness of the fit. For this analysis, we used a PSF made from stacking nonsaturated stars observed in the regions surrounding BOSS1244 and then used a science-image cutout and a sigma image to create a model of a single-component Sérsic galaxy, chosen so as to not overfit the data, and characterized each galaxy in terms of its radius (r), Sérsic index, axis ratio, ellipticity, and magnitude. Beyond any initial conditions regarding values of Sérsic index and radius, GALFIT simultaneously fits all components of a given galaxy, taking into account the detected object and the sky background (Peng et al. 2002, 2010a), as well as convolving all modeled profiles based on the provided PSF to simulate telescope optics.
To increase the computational efficiency of our analysis, we used GALAPAGOS-2/MEGAMORPH (Barden et al. 2012; Häußler et al. 2013), an IDL-based GALFIT wrapper that combines GALFIT with SOURCE EXTRACTOR (Bertin & Arnouts 1996). Instead of providing a single postage stamp image of each target galaxy, GALAPAGOS samples the entire mosaic and does two runs of SOURCE EXTRACTOR in a hot and cold detection mode to create multiple detection maps to separate and identify all galaxies in a given field, which is particularly useful in dense protocluster fields. From these detections, we used GALAPAGOS to create image cutouts and fit all of the parameters via GALFIT. When running GALAPAGOS, we followed the same input parameters as specified in van der Wel et al. (2012) and Afanasiev et al. (2023, e.g., 0.2 ≤ n ≤ 8, 0 3 ≤ r, and used a tophat_9.0_9x9 filter for the cold SOURCE EXTRACTOR run and a gauss_4.0_7x7 filter for the hot SOURCE EXTRACTOR run), each of which analyzed the morphology of high-z (z ∼ 2) galaxies observed with HST. Importantly, given the necessary precision for high-z morphology measurements, we limited our analysis to galaxies brighter than mF160W < 24.5 magnitudes, following van der Wel et al. (2012), which is approximately half a magnitude above our detection limit and includes ∼97% of our HAEs. Although the limiting magnitudes differed between this sample and the CANDELS coeval field sample (see Sect. 2.4), the 24.5 magnitude analysis limit was brighter than both detection limits, which allowed us to compare our analysis to results from van der Wel et al. (2012). Although the Sérsic index measurements for galaxies fainter than this limit had similar error bars to their brighter counterparts, we found that for a small sample of these faint galaxies, the radii tended to be overestimated, possibly due to confusion with the background, which impacts the goodness of the overall fit.
After running GALAPAGOS, we visually inspected each target, model, and residual to ensure correct identification and check for any galaxies where the fit residual was particularly poor. We found that GALAPAGOS failed for ∼5% of our targets (e.g., no resulting fit is given, despite a galaxy being included as a target). Typically, these galaxies are the brightest, unresolved galaxies in our sample, some of which are among the sample of HAEs that were identified as quasars in Shi et al. (2021), where the size of the galaxy is consistent with that of our observed PSF. Additionally, we further inspected the sample and removed any galaxy where the reduced-χ2 of the fit was greater than 2, to only keep the best fit galaxies in our sample (see Appendix B and Fig. B.1 for examples of the residuals of our Sérsic index fits). This left us with 80 galaxies in BOSS1244 and 71 galaxies in BOSS1542 (see Fig. 2 for examples of HAEs). Additionally, while GALAPAGOS identified the target galaxy nearest to our emitting galaxy input coordinates, because the angular resolution of the Ks-band images is much worse than our HST images (the seeing was ∼0 65–0
65–0 8 for the Ks-band images), we had multiple examples of previously blended systems. For our analysis, if we had two distinct galaxies in HST, we chose the galaxy closest to the coordinates of the HAE (which is typically the brighter galaxy). For five pairs, the two galaxies are truly blended in the Ks band, with the central coordinate of the HAEs falling squarely between the two galaxies in the HST imaging. In those instances, we included both galaxies.
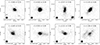 |
Fig. 2. Image cutouts of HST WFC3 F160W detected HAEs in BOSS1244 (top row) and BOSS1542 (bottom row). A selection of early-type galaxies are shown in the left two columns and a selection of late-type galaxies are shown in the right two columns. The Sérsic index of each galaxy is included at the top of each cutout. Each cutout is 2 |


Given the proclivity of mergers in high-z protoclusters (e.g., Watson et al. 2019; Liu et al. 2023, 2025; Giddings et al. 2026), as well as clumpy galaxies (e.g., Shibuya et al. 2016; Umehata et al. 2025; Kalita et al. 2025), it is possible that some of these galaxies are merging or clumpy systems. As shown by Liu et al. (2023), BOSS1244 and BOSS1542 host a number of potentially merging galaxy pairs. Specifically, Liu et al. (2023) performed an analysis of potential close pairs, galaxies that are near each other in physical space, but do not show obvious signs of mergers (e.g., Kartaltepe et al. 2007; Lotz et al. 2011; Snyder et al. 2017; Giddings et al. 2026). Here, we adopt a more cautious approach for identifying merging systems. For the close pairs identified in Liu et al. (2023), we only reported on the pair members that are HAEs (we did identify one close pair of HAEs in BOSS1244 and two close pairs of HAEs in BOSS1542). However, potentially merging galaxies are not limited to close pairs in protoclusters or in the field. Following our initial visual inspection of the GALAPAGOS postage stamp and the model residual image, we inspected any merger candidates using Kartaltepe et al. (2015) as a guide to classify potentially isolated, merging (or clumpy), and interacting galaxies (see Fig. 3). Using this approach, we looked for the existence of tidal tails/elongated galaxy structures between nearby galaxies or the appearance of merging systems. Although we identified potentially interacting systems, our interpretations are limited by our lack of spectroscopy for many of these interacting systems. We therefore focused on “multi-peak” galaxies, potential mergers that we visually identified as a single galaxy (based on GALAPAGOS and SOURCE EXTRACTOR detections), but seen visually as multiple bright peaks in the same galaxy (see Fig. 3 for examples of multi-peak systems; see Sect. 3.2 for further discussion of these systems). Although some of these may be edge-on spiral galaxies or clumpy star-forming galaxies, we find some show additional signs of mergers (e.g., diffuse tidal tails).
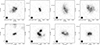 |
Fig. 3. Image cutouts of a selection of HST WFC3 F160W detected multi-peak galaxies identified in BOSS1244 (top row) and BOSS1542 (bottom row). Each cutout is 2 |


2.3. Measuring the local density
Since the HST coverage of our protocluster candidates did not cover the entire structure, we could not create a robust measurement of the protocluster density relative to the co-spatial field at all points in the protocluster. Instead, we focused on measuring the local density of every HAE. Although all galaxies in our sample are emitters, we only characterized the morphology of HST detected galaxies brighter than mF160W < 24.5 mag (van der Wel et al. 2012). While there is not a one-to-one relation between the Ks band magnitude and the HST WFC3 F160W magnitude, given that 97% of our galaxies were above the detection threshold, we could estimate the density without adding additional sources of error. For our analysis, we characterized the local density by measuring the number of emitting galaxies within 300 kpc1 of each HAE.
As our density measurements trace a population of star-forming and relatively massive HAEs, it is important to note that there may be some biases regarding how HAEs map to the density of the entire protocluster population. Specifically, if either protocluster contains a large population of fainter star-forming or quiescent galaxies that are not co-spatial to the denser regions of the HAEs, then some of our lower density regions may actually have higher densities than our HAE estimate. In fact, in simulations, Baxter et al. (2025) traced the location of the highest density peak in protoclusters at 1 < z < 5 and found that the location of the highest density peak in protoclusters at z > 2 does depend on the stellar mass or SFR cuts, suggesting a degree of variability among density measurements. Using our coeval background field (see Sect. 2.4), we tested our density measurements with different stellar mass and star formation rate cuts. Doing so, we found the most scatter among the lowest density regions. However, these lower-density measurements are generally below the lower-density bins in the protocluster sample. This suggests that the majority of the density measurements in the protocluster sample should not be impacted greatly by changes in our selection criteria. Although these density fluctuations are likely a smaller effect in the densest regions, some degree of error in our morphology-density measurements (see Sect. 3) may be due to the density measurements.
2.4. The comparison field samples
To determine whether the morphology of protocluster galaxies is influenced by the protocluster environment, we need a coeval field sample. For comparison, we used the well-analyzed CANDELS (e.g., Grogin et al. 2011; Koekemoer et al. 2011; Kodra et al. 2023) survey fields because van der Wel et al. (2012) previously characterized the morphology of CANDELS galaxies and measured the Sérsic index of the galaxies using the HST WFC3 F160W band. Since our HST imaging was done in the same F160W band and the protocluster sample and a coeval field sample have limiting magnitude depths fainter than the 24.5 magnitude analysis threshold and used identical GALAPAGOS analysis tools, we could compare our observations to these values to constrain the impact of the protocluster environment on galaxy morphology. Because the redshift range of the HAEs we studied is very narrow, however, based on our narrow-band emission (2.246 ± 0.02, in agreement with the measurements from Shi et al. 2021), we statistically created our coeval field galaxy sample. We first treated all galaxies with mF160W ≤ 24.5 magnitudes (the magnitude limit of our morphology analysis) in the CANDELS fields as potential high-z galaxies. Using robustly measured photometric redshifts (Kodra et al. 2023), we accounted for the likelihood that each galaxy lies at the redshift of our HAEs. To do this, we did a first-order estimate of the redshift probability distribution function for each galaxy assuming that each galaxy’s photometric redshift followed a Gaussian distribution centered on the reported value with the width estimated from the error in the photometric redshift. We then integrated the area under the curve corresponding to our narrow redshift window (2.246 ± 0.02). Because the median photometric redshift uncertainty for CANDELS high-z galaxies is Δz ∼ 0.2, the statistical likelihood that these galaxies fall within our redshift range is low, typically ∼40% at most. Thus, to capture the statistical coeval field sample, we summed the total weight of the likelihood of each galaxy being in our redshift range assuming Gaussian error. To measure the density of the galaxies, we used the same 300 kpc (at z ∼ 2.23) region as our target fields (note that we excluded galaxies near the edges of the CANDELS fields to avoid undersampling the density) and measured the weighted likelihood that all of the galaxies in the 2D projection are at our target redshift. As a result, we can estimate the density and morphology of typical galaxies that are not in protoclusters at cosmic noon.
Although less common, some fraction of the high-z galaxies from the CANDELS catalogs from Kodra et al. (2023) are quiescent galaxies (e.g., Merlin et al. 2019). As our sample of protocluster HAEs did not include quiescent galaxies2, we created an additional coeval field consisting only of those galaxies in CANDELS with measured SFRs and stellar masses from Osborne & Salim (2024). Osborne & Salim (2024) estimated their SFRs using UV, optical, and mid-IR photometry for 63 266 galaxies at 0.7 < z < 2.3 in the GOODS-S, UDS, COSMOS, and EGS fields. With these additional parameters, we created an additional coeval field sample. This CANDELS coeval field subsample (labeled CANDELS M* & SFR lim in Figs. 5 and 6) consists of all galaxies with mF160W < 24.5 with a stellar mass greater than 1010.3M⊙ and a SFR > 20 M⊙/yr. The stellar mass limit and the stellar masses of the galaxy sample in BOSS1244 and BOSS1542 are presented in Liu et al. (2023). Although the detection limit for identifying an HAE in our sample was reported to yield a SFR of 5.1 M⊙/yr in Zheng et al. (2021), as shown in Fig. 4, the minimum dust-corrected HAE star-formation rate, calculated following the description for HAEs in Zheng et al. (2021), is well above this. For a better statistical sample, we therefore used a limiting SFR of 20 M⊙/yr. For the coeval field subsample, we again measured the density of galaxies following the same prescription as we did for the CANDELS field sample, where we weighted the likelihood that each galaxy is within our narrow redshift range (as seen based on the color of the coeval field galaxies in Fig. 4) and then measured the weighted number of galaxies within 300 kpc of each targeted galaxy (see Table 2 for the weighted number of galaxies in each sample).
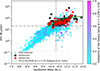 |
Fig. 4. Star formation rate as a function of stellar mass for our samples of HAEs from BOSS1244 and BOSS1542 overplotted on the coeval sample of field galaxies with SFRs and stellar masses from Osborne & Salim (2024) in the CANDELS fields. The color of the coeval field sample galaxy represents the likelihood that a given galaxy is at z = 2.246 ± 0.02 based on the photometric redshifts from Kodra et al. (2023). We overplotted an estimate of the star formation main sequence at z = 2.23 based on the analysis in Popesso et al. (2023) in green. Because the star formation main sequence is calibrated using a Kroupa IMF, we converted the star formation rates and stellar masses to reflect the Chabrier IMF used in Osborne & Salim (2024). Although we measured the likelihood that all galaxies, regardless of the median redshift estimate are at z = 2.246, in the above plot, we only included those galaxies with a median photometric redshift (or spectroscopic redshift) of 2 < z < 3. The vertical line represents the 90% stellar mass completeness limit for BOSS1244 and BOSS1542 (1010.3 M⊙) based on the analysis in Liu et al. (2023). The horizontal line shows our estimate of the SFR completeness limit (20 M⊙/yr). |
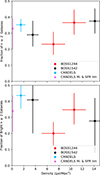 |
Fig. 5. Morphology-density relation in two MAMMOTH protoclusters, BOSS1244 (in red) and BOSS1542 (in black). The weighted CANDELS field is shown in blue and the CANDELS stellar mass and SFR sample (CANDELS M* & SFR lim) is shown in magenta. Top: All detected galaxies brighter than our magnitude threshold (mF160W ≤ 24.5). Bottom: All detected galaxies brighter than m*+1, where m* is the modeled magnitude of an L* galaxy at z = 2.246 estimated using EzGal (i.e., mF160W ≤ 23.36 magnitudes; Mancone & Gonzalez 2012). In each plot, the density measurement is for the entire sample. The value of the fraction of galaxies with n ≥ 2 for each sample is measured by bootstrapping over the measured errors in Sérsic index over 1000 iterations. We found evidence for an internal morphology-density trend in both protoclusters among all galaxies, but no evidence for an enhancement of the early-type fraction relative to the field. The brighter galaxies in each protocluster differed, however, with the denser regions of BOSS1542 having fewer early-type massive galaxies. |
Coeval field samples.
We acknowledge that although we apply similar stellar mass and SFR cuts between our two samples, the protocluster population is entirely HAEs, while the background sample is star-forming galaxies. As highlighted in Oteo et al. (2015) and as seen in Fig. 4, HAEs should probe a similar parameter space to typical star-forming galaxies at z ∼ 2.0 and only differ among the least massive systems. Since our magnitude limit is ∼90% complete down to masses of 1010.3 M⊙, we did not probe low-mass galaxies. The parameters of these galaxies therefore strongly agree in terms of SFR and stellar mass (see Appendix C and Fig. C.1 for a comparison of the distribution of Sérsic index, stellar mass, and SFR between the protocluster and coeval field samples). Additionally, we found that all of our HAEs, as well as the coeval field sample fall within 1 dex of the star formation main sequence at z = 2.23 from Popesso et al. (2023, see our Fig. 4).
3. Results
3.1. The morphology-density relation
After measuring the morphology of each HAE with GALAPAGOS and the density of the surrounding galaxies, we plotted the morphology as a function of local density for the star-forming HAEs in BOSS1244 and BOSS1542 (see Fig. 5; for the analysis of BOSS1441, see Appendix A and Fig. A.2). To search for environmental trends, we separated our galaxies into a low- and high-density sample, aiming for two approximately equal size density bins. To quantify the error in these measurements, we used a bootstrap technique where we run our analysis 1000 times, treating the initial error in the Sérsic index from GALAPAGOS as Gaussian. We estimated what fraction of galaxies are early-type in each bin and the error in this measurement, which accounts for galaxies that are just below/very near our Sérsic index division and are borderline cases. We then added our error in quadrature with the error estimated from the binomial confidence intervals to get the final error bars shown in Figs. 5 and 6. For the density measurements, we estimated the error by taking the total number of emitters within the Ks-band FOV and randomly placing them in the field and then measuring the number of galaxies within 300 kpc of each galaxy. We similarly bootstrapped this density and estimated the median number of nearby neighbors as the error in the density.
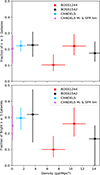 |
Fig. 6. Morphology-density relation in BOSS1244 and BOSS1542 for strongly bulge-dominated galaxies (n ≥ 3). The same legend is used as in Fig. 5. Top: All detected galaxies brighter than our magnitude limit (mF160W < 24.5). Bottom: All detected galaxies brighter than an m*+1 galaxy at z = 2.246. In each plot, the density measurement is for the entire sample. As in Fig. 5, the value of the fraction of galaxies with n ≥ 3 for each sample is measured by bootstrapping over the measured errors in Sérsic index over 1000 iterations. Here, we see a local morphology-density relation in BOSS1244, but no such relation in BOSS1542, pointing to differences in the evolutionary states of these protoclusters. |
The top panel of Fig. 5 highlights that both protocluster systems show an increase in the number of early-type galaxies in the denser bin. Because these values differ by less than 1σ, however, we cannot statistically confirm the morphology-density relation in these two protoclusters. Since we did not have HST coverage of the entire field and only observed the denser regions of each protocluster, we could not probe the outskirts of the protoclusters, which limited our ability to look at the buildup of this relation from the outskirts of the protocluster, where the early-type fraction should be closer to the field, to the densest regions. Relative to the coeval field samples we constructed from CANDELS, however, we did not find a statistical enhancement in the fraction of early-type galaxies. In fact, we found that the early-type fraction in the low-density bin is below field levels in BOSS1244 and that all of the values in the higher density bins are within 1σ of the field values.
To further quantify any differences among the field and protocluster populations, we performed a KS test to compare the distribution of Sérsic indices among the statistically similar stellar mass and SFR limited coeval field sample to the two protoclusters (see Fig. C.1). We found no evidence that they are drawn from different populations (P1244 − Field = 0.83, P1542 − Field = 0.98). Ultimately, we found little evidence that the morphology of these protocluster HAEs differs greatly from their field counterparts. Because our sample only includes primarily massive and relatively high star-forming HAEs, however, it is possible that any morphological transformations due to the protocluster environment occur among populations of galaxies with either lower SFRs that we are not sensitive to or lower masses that we are not probing, which would be similar to the dominance of mass quenching among bright cluster galaxies seen out to z ∼ 1.5 (e.g., Peng et al. 2010b; Hewitt et al. 2025, see our Sect. 4 for further discussions on the morphological transformation of protocluster galaxies). Additionally, as seen in Fig. 3, we identified a number of multi-peak galaxies, which may not be well characterized by a Sérsic index and could impact our lack of evidence of a strong morphological difference between protocluster and field galaxies (see Sect. 3.2).
As discussed in Shi et al. (2024), BOSS1244 contains a population of massive and bright protocluster galaxies. Because high-z massive cluster galaxies have been shown to be more quenched than their lower-mass counterparts (e.g., Rudnick et al. 2012; Kawinwanichakij et al. 2017; Lee-Brown et al. 2017) and in simulations, protocluster populations are found to be older than their field counterparts (e.g., Hatch et al. 2014; Overzier 2016), we compared the fraction of massive, bright early-type galaxies in our protoclusters to their field counterparts in the bottom panel of Fig. 5 (we used mF160W < 23.36, 1 magnitude fainter than the magnitude of an L* galaxy at z = 2.246 as estimated in the HST WFC3 F160W band using EzGal; Mancone & Gonzalez 2012). While the overall results for BOSS1244 and the two coeval field samples remain relatively unchanged, we saw a stark difference between the internal distributions of early-type galaxies in BOSS1244 and BOSS1542, with BOSS1542 hosting more massive early-type galaxies in the low-density region than the high-density region, though the difference is not statistically robust.
Within the full sample, we found a number of massive, strongly bulge-dominated early-type galaxies, with Sérsic indices ≥3, similar to what was seen in Shi et al. (2024). To determine if this population existed beyond the smaller spectroscopic sample in Shi et al. (2024) and in the population of emitters as a whole, we looked at the fraction of strongly bulge-dominated early-type galaxies (n ≥ 3) in each protocluster system (see Fig. 6; we note the density measurements in this figure represent the density of all galaxies and are the same as in Fig. 5). As clearly shown, the trends between coeval field samples and distributions in BOSS1244 are not changed in any statistically significant way. Interestingly, for the entire sample and the sample of only bright n ≥ 3 early-type galaxies, the distribution in BOSS1542 is again inverted. Given that BOSS1244 shows a stronger local morphology-density trend among bright galaxies than BOSS1542, though neither trend is statistically robust, this may represent additional evidence, along with the previously reported quiescent galaxies in BOSS1244 and the difference in protocluster morphology, that these protoclusters are at different evolutionary states.
3.2. Galaxy mergers and clumpy galaxies
To further probe galaxy evolution within MAMMOTH protoclusters, we revisited the population of merging/clumpy galaxies. As highlighted in Liu et al. (2023) and Liu et al. (2025), BOSS1244 and BOSS1542 include large populations of close pair galaxies that are merger candidates. Such mergers could be key to determining the differences between Figs. 5 and 6 and the previously discussed stronger morphology-density relations found at 1 < z < 2 (e.g., Sazonova et al. 2020; Noordeh et al. 2021; Mei et al. 2023) that include quiescent galaxies. Beyond the population of close pairs and mergers identified in Liu et al. (2023), the similarity of the morphology of protocluster galaxies relative to the coeval field may be caused by the clumpy, multi-peak galaxies that populate our protoclusters. Using the same density measurements as in Fig. 5, we plotted the fraction of multi-peak merging galaxy candidates among the total number of emitting galaxies as a function of density (see the top panel of Fig. 7).
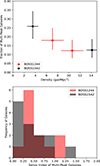 |
Fig. 7. Top: Merger-density relation for the multi-peak galaxies in two MAMMOTH protoclusters. Bottom: Histogram of the Sérsic indices of multi-peak galaxies. As previously noted, BOSS1244 is shown in red and BOSS1542 is shown in black. The density measurements are identical to those found in Figs. 5 and 6. |
As seen in the top panel of Fig. 7, the majority of our multi-peak merging galaxies are found in the least dense protocluster environments. This is intriguing because in BOSS1244, the close-pair galaxies from Liu et al. (2023) are in the densest protocluster environment, while BOSS1542 has a closer to uniform fraction of close-pair galaxies in our density bins. Despite the differences in the location of the merging galaxies, if some fraction of the ∼20% of HAEs that are multi-peak galaxies are true mergers, this will increase the overall number of merging galaxies in these systems from the previously measured values 22±5 (BOSS1244) and 33±6 % (BOSS1542; Liu et al. 2023) and indicates an overall elevated level of merging galaxies across the entire protocluster. This elevated merger fraction would be closer to the fraction of close kinematic pairs (∼49 ) in the Hyperion proto-supercluster (z = 2.5; Giddings et al. 2026), as well as similar merger fractions (20%–48%) in protoclusters and field galaxies at 2 < z < 3 (e.g., Hine et al. 2016; Monson et al. 2021; Shibuya et al. 2025).
More important to the evolution of star-forming protocluster galaxies into their eventual quiescent, early-type counterparts is the morphology of these clumpy galaxies. We found that all multi-peak protocluster galaxies have n < 1.5 when fit with a single Sérsic function using GALAPAGOS, with ∼88% of these systems having n < 1 (see the lower panel of Fig. 7). It is important for our characterization of the similarities between the fraction of early-type galaxies in the protocluster and the field, however, that these galaxies do not appear to be classical late-type galaxies. Specifically, despite these multi-peak galaxies having GALAPAGOS fits with reduced-χ2 < 2, if these sources are not true late-type galaxies, then our fractions of early-type galaxies may be lower limits on the number of early-type galaxies as these sources have ambiguous morphologies. If the multiple bright peaks are indicative of a recent merger, however, then these multi-peak galaxies may be an important sign for the buildup of the future morphology-density relation as they could indicate that the morphology of these systems is in flux and will soon transform, increasing the population of early-type galaxies in these systems (e.g., Toomre et al. 1977; Naab et al. 2006; Rodriguez-Gomez et al. 2017).
4. Discussion
As discussed in Sect. 3, using HST WFC3 F160W imaging of two MAMMOTH protoclusters at z ∼ 2.23, we probed the morphology of HAEs as a function of density for these star-forming protocluster galaxies. Although we saw a slight increase in the fraction of early-type galaxies in denser regions in BOSS1244, it is not at a statistically significant level relative to the coeval field and we found general agreement between the fraction of early-type galaxies in the field and protoclusters. As we examined exclusively star-forming protocluster galaxies, understanding how the morphology of these star-forming protocluster galaxies compares to similar protocluster studies, particularly those including quiescent galaxies, may help to illuminate the morphological transformation and evolution of protocluster galaxies.
4.1. A comparison with other protocluster studies
Given that we only have two protoclusters, we contextualize our findings among the broader protocluster/high-z cluster results found in the literature to understand the transformation of late-type galaxies in high-z protoclusters into early-type galaxies in low-z clusters. Importantly, the MAMMOTH sample is unique compared to many other high-z morphology studies because we are exclusively examining HAEs. One similar sample exists in Naufal et al. (2023), however, who studied a sample of four protoclusters populated by HAEs, including the Spiderweb protocluster (z = 2.16; Miley et al. 2006), one of the most well-studied high-z systems. While the evolutionary states of our MAMMOTH protoclusters and the Spiderweb protocluster differ (Spiderweb hosts a virialized core, a lower merger fraction, and a detected proto-ICM; Di Mascolo et al. 2023), the other protoclusters (2.16 < z < 2.53) appear to have similar to slightly smaller populations of HAEs compared to the MAMMOTH protoclusters (e.g., Shimakawa et al. 2018a; Darvish et al. 2020; Koyama et al. 2021; Naufal et al. 2023), making this an ideal comparison sample. Because Naufal et al. (2023) used HST Advanced Camera Survey (ACS) F814W data, we cannot directly compare the morphology measurements of their sample of 122 protocluster HAEs to our sample, but we can compare their environmental trends. Specifically, Naufal et al. (2023) found a median Sérsic index of 0.76 for protocluster galaxies and 0.80
 for their coeval field sample, which points to similar morphologies between protocluster and field galaxies, in agreement with our findings. In doing a nonparametric morphology study, Naufal et al. (2023) further affirmed the similarities between the protocluster and field galaxies, finding similar values for the concentration, asymmetry, Gini, and M20 parameters. Although they do not explicitly plot a morphology-density relation, Naufal et al. (2023) performed a stacking analysis and found a difference between the Sérsic index of protocluster galaxies (n = 1.55
 ) and field galaxies (n = 1.02
 ), which would imply a slight environmental impact not seen in MAMMOTH protoclusters, although both populations are still dominated by late-type galaxies. Beyond galaxy morphology, Naufal et al. (2023) also found an abundance of protocluster HAEs with disturbed and clumpy morphologies relative to their field sample. Although this classification is not identical to our population of multi-peak galaxies, both attempted to identify similarly unique galaxies, and both point to the protocluster environment enhancing the fraction of these clumpy and/or merging star-forming HAEs relative to the field.
Pérez-Martínez et al. (2023) continued the study of HAEs in the Spiderweb protocluster, finding that most of their spectroscopically confirmed HAEs have surface brightness profiles typical of high-z late-type galaxies. Given that a separate population of quiescent galaxies was recently identified in Spiderweb (Naufal et al. 2024), the similarity in surface brightness and morphology, as well as the results of Naufal et al. (2023), may indicate that regardless of the overall protocluster evolutionary state, HAEs have not undergone a large degree of morphological pre-processing in these coeval protoclusters. Thus, because we only use HAEs and lack a large population of separately identified quiescent galaxies, this may lead to a potential bias in our estimate of the overall morphology of protocluster populations in BOSS1244 and BOSS1542.
Using similar HST ACS F814W observations to Naufal et al. (2023), Peter et al. (2007) studied a protocluster at z = 2.3 and also compared the morphology of their protocluster galaxies to a coeval field sample. Similar to our results and the results from Naufal et al. (2023), they found no evidence of an environmental influence. As this sample consists entirely of UV-selected star-forming galaxies, this adds further credence to lack of environmental impact on the morphology of star-forming galaxies in protoclusters.
To compare our results to a larger sample, we examined the CARLA clusters at 1.4 < z < 2.8 studied in Mei et al. (2023) and Afanasiev et al. (2023). Despite the MAMMOTH protoclusters being within the redshift range of the CARLA sample and Mei et al. (2023) using similar HST imaging to probe the morphology-density relation, we did not find strong agreement. This is likely the result of the difference in galaxy populations and morphology measurements. While Mei et al. (2023) found a strong abundance of bulge-dominated galaxies in all CARLA protoclusters, the CARLA protoclusters, though spectroscopically-confirmed, use color-cut criteria to identify member galaxies, which allowed for populations of star-forming and quiescent galaxies to be identified (Mei et al. 2023; Afanasiev et al. 2023). Furthermore, Mei et al. (2023) posited that the low-frequency of color-color selected star-forming galaxies and the high passive galaxy fraction in their clusters were because these systems have already undergone starburst star formation, which would further separate our populations of protoclusters hosting large populations of HAEs. Given that all but one CARLA cluster is at z < 2.1, this may also indicate that the CARLA clusters are more dynamically evolved systems and that the MAMMOTH systems are progenitors. We also note, however, that Mei et al. (2023) used visual classification to characterize the morphology of galaxies in the CARLA sample. Although Afanasiev et al. (2023) found general agreement between their GALAPAGOS morphology measurements and the visual classification done in Mei et al. (2023), the difference in the strength of the morphology-density relation may be due to inherent differences between a visual classification scheme and our GALAPAGOS measurements.
In comparing the highest redshift studies of galaxy morphology at cosmic noon (2.1 < z < 3), most reported little environmental trends. From the Naufal et al. (2023), Mei et al. (2023), Peter et al. (2007) studies, and our own work, only Mei et al. (2023) showed strong evidence of a morphology-density relation in protoclusters. In fact, the highest redshift source, which is in Mei et al. (2023), is at z ∼ 2.8 and has a bulge-dominated fractions that is only slightly above their estimate of the coeval field level and below the level of the rest of their sample. As Mei et al. (2023) reported a strong population of early-type galaxies and their sample selection allows for the inclusion of quiescent galaxies, this points to quenching playing a more prominent role in the buildup of the morphology-density relation and may be evidence that these systems are found at different evolutionary states. This may suggest that the dynamical evolution of clusters/protoclusters is key to enhancing the rapid buildup of the morphology-density relation and further highlights the large degree of protocluster variation that hinders these evolutionary studies. To fully address the role of protocluster evolution, galaxy quenching, and mergers in the buildup of the morphology-density relation, there is a clear need for a large statistical study to map protocluster populations across cosmic time.
Ultimately, because we only probed star-forming HAEs, our sample was biased against large populations of low-SFR galaxies, and/or low-mass galaxies. Although BOSS1244 has two spectroscopically confirmed quiescent galaxies (Shi et al. 2024; see Sect. 4.3 for our further analysis of the spectroscopic sample), which may indicate that more quenched galaxies exist in these protocluster systems, we cannot exclude the inherent bias in our sample as a reason why we did not see an environmental impact on galaxy morphology. Regardless of any missing populations within our protoclusters, however, it is important to contextualize the morphology of these star-forming galaxies and how it might evolve. Specifically, Barro et al. (2017) noted that the morphological transformation of star-forming galaxies at cosmic noon likely occurs via compaction, which would increase star formation before AGN driven quenching can occur. As compaction occurs over 0.5 - 1.0 Gyr timescales, while quenching occurs on gigayear timescales (Barro et al. 2017), the absence of a surplus of early-type star-forming galaxies in MAMMOTH systems relative to the CARLA systems is likely due to the evolutionary timescales. By z ∼ 2, if these HAEs undergo compaction, they could increase the population of early-type galaxies and be in the process of quenching. Within our protocluster sample, we found that, on average, early-type HAEs in these protoclusters are slightly smaller than their late-type counterparts, which could be evidence of compaction in these galaxies. Although it is possible that the early-type galaxies in both the protocluster and the field transform via compaction, however, a robust study of protocluster and coeval field galaxy size in conjunction with morphology is necessary to better constrain whether compaction is driving any morphological transformations in MAMMOTH protoclusters.
Furthermore, the most actively star-forming and potentially most compacted galaxies in these systems may be missed in our analysis because Zhang et al. (2022) found evidence of submillimeter galaxies on the outskirts of each protocluster. Additionally, recent JWST observations comparing the morphology of massive star-forming galaxies at cosmic noon identified a population of optically disk-dominated galaxies that are characterized as bulge dominated in the infrared (Benton et al. 2024), which may indicate that some of the late-type star-forming galaxies we have characterized have indeed begun their morphological transformation. Thus, despite the lack of environmental trends regarding the morphological transformation of HAEs in MAMMOTH protoclusters, there are still multiple avenues to explore to continue probing the evolution of these protocluster HAEs.
4.2. Populations of bright and merging protocluster galaxies
Despite the lack of true quiescent galaxies in our sample of HAEs, we did identify bright, early-type protocluster galaxies in each system, although they are more of a dominant population in BOSS1244 (see the lower panels in Figs. 5 and 6). While many of these bright galaxies have M* > 1011 M⊙, we saw no enhancement in the fraction of bright early-type galaxies relative to the field. Although the majority of newly identified high-z quiescent galaxies are massive (e.g., Carnall et al. 2024; Nanayakkara et al. 2025; de Graaff et al. 2025), the lack of an abundance of massive early-type galaxies among our population of HAEs may further indicate that the environment is not the driving factor for the morphological transformation of these massive galaxies. While we have already discussed that quenching and morphological transformation are not the same process, our results do agree with prior results studying the evolution of quenched galaxies, which found that the passive galaxy fraction is independent of environment at 1 < z < 3 in the COSMOS field and that the quiescent fraction only depends on stellar mass at z ∼ 3.0 (Darvish et al. 2015, 2016). If the morphological transformation of protocluster galaxies is similarly driven by stellar mass and not the environment, then the similar populations of early-type galaxies among the field and protoclusters, as seen in this work, could be further evidence that the timescale for the morphological transformation of galaxies at cosmic noon does not depend on environment.
Another potential formation mechanism for early-type galaxies seen in protoclusters are galaxy mergers (e.g., Hine et al. 2016; Watson et al. 2019; Monson et al. 2021; Giddings et al. 2026; Shibuya et al. 2025). Importantly, the high merger fraction in BOSS1244 and BOSS1542 (measured in Liu et al. 2023 as 22±5 % and 33±6 % in each protocluster relative to the merger fraction of 12±2 % in their CANDELS coeval background field), and in particular, the abundance of visually identified multi-peak galaxies (see Fig. 7), may also explain why we did not identify a strong morphology-density relation relative to the coeval field. Liu et al. (2023) estimated a merger timescale for massive galaxies in BOSS1244 and BOSS1542 of 0.63 ± 0.05 Gyr. If we assume that some fraction of our multi-peak galaxies are post-merger systems, this would mean that new early-type and potentially quenched galaxies would appear in these protoclusters by z ∼ 2. Moreover, the close-pairs from Liu et al. (2023) will also increase the population of early-type galaxies by z ∼ 2. When our multi-peak population and the close-pair population are combined with the existing fraction of n ≥ 3 galaxies (∼25%; see Fig. 6), the early-type fraction increases to the 50–60% seen in Mei et al. (2023).
4.3. A closer look at BOSS1244
Although the goal of this paper is to present an analysis of the impact of the protocluster environment on the morphology of HAEs in two MAMMOTH protoclusters, here we focus only on BOSS1244, which contains two spectroscopically-confirmed quiescent galaxies (Shi et al. 2024), 46 other spectroscopically-confirmed HAEs (Shi et al. 2021), and an additional 14 star-forming galaxies identified via HST grism observations (although four HAEs with spectroscopic redshifts fall outside of our redshift range, each is at 2.09 < z < 2.22, so they remain potential protocluster members and we included them in this analysis; Shi et al. 2021). For this reason, along with the additional HST WFC3 F125W photometry that only exists for BOSS1244, we probed the color and distribution of the protocluster galaxies relative to the known quiescent BCG in BOSS1244. As with the previously discussed HAEs, we used GALAPAGOS to measure the morphology of all additional spectroscopically-confirmed galaxies in an identical manner to the HAEs. Although not shown, despite the presence of two quiescent massive galaxies, we found no statistical difference in the morphology-density relation for BOSS1244 when accounting for the new spectroscopic members.
The transformation of protocluster galaxies into their low-z counterparts requires a morphological transformation and quenching. Thus, despite studying a sample of nearly all HAEs, and given the abundance of recently identified populations of quiescent galaxies in high-z clusters and protoclusters (e.g., Willis et al. 2020; Noordeh et al. 2021; McConachie et al. 2022; Jin et al. 2024; McConachie et al. 2025), we present a color-magnitude diagram of all detected galaxies above our magnitude-limit (mF160W = 24.5 magnitudes and mF125W = 24.95 magnitudes) to determine whether any indication of early signs of quenching exists in BOSS1244. In Fig. 8, the color of each point is determined by the Sérsic index. Although our fitting allows for Sérsic indices ranging from 0.2 to 8.0, we include a color bar ranging from 0 to 4, where late-type galaxies are colored black and early-type galaxies are colored orange. By using the F160W and F125W bands, we straddle the 4000 Å break at z = 2.246, meaning that we should be able to select red sequence galaxies if any are present. Also, we note that all spectroscopic galaxies and HAEs are not shown in Fig. 8 as some do not have dual-band imaging and some are not detected at the magnitude limit in both bands (see Appendix D and Fig. D.1).
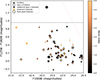 |
Fig. 8. Color-magnitude diagram for BOSS1244. The HAEs are shown in circles. The spectroscopically-confirmed HAEs have a diamond surrounding them. The multi-peak galaxies have a hexagon surrounding them. The additional spectroscopic star-forming galaxies from HST grism are shown by a plus sign. The quiescent galaxies are shown in squares. The horizontal dashed line shows the color of a modeled red sequence galaxy based on EzGal models (Mancone & Gonzalez 2012) for a galaxy at z = 2.246. The pink dot-dashed line shows the magnitude limit for our analysis. The color of each point is based on the Sérsic index; late-type galaxies are darker and early-type galaxies are more orange. |
Unlike the strong bulge-dominated red sequence found in XLSSC 122 at z ∼ 2.0 (Noordeh et al. 2021), we found no evidence for an early forming red sequence, even when including the spectroscopic members. We also found no correlation between the color and morphology for the total sample. This is also true among the HST grism spectroscopic sample, which spans a similar range in color and morphology to the HAEs. Furthermore, of the multi-peak galaxies shown, some have colors similar to the quiescent galaxies, while others are much bluer. Given the small number of spectroscopic galaxies and the spread in the color and morphology of the emitters as a whole, we cannot claim any strong degree of quenching among this star-forming population, or among our population of HAEs.
Interestingly, despite the differences between BOSS1244 and XLSSC 122 in terms of early-type red sequence populations, Noordeh et al. (2021) found that ∼33 of their star-forming galaxies have a bulge-dominated morphology, which agrees with our results. As Noordeh et al. (2021) posited that the environment does not play a role in the transformation of galaxy morphology at these redshifts, this similarity may further indicate that we are observing structures at different evolutionary points in their lifetimes and that further studies will be necessary to disentangle quenching and morphological transformations.
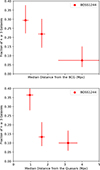 |
Fig. 9. Fraction of strongly bulge-dominated early-type galaxies (n ≥ 3) as a function of the distance from the BCG (top) and the distance from two quasars (one quasar at z = 2.236, and the other at z = 2.229; bottom). The quiescent BCG and the two quasars are ∼1 Mpc apart. In both cases, we found a peak in the distribution of n ≥ 3 bulge dominated galaxies near the target galaxy, with the BCG showing a less steep distribution. |
Similar to the morphology-density relation, low-z clusters are commonly characterized by a dense core of red sequence elliptical galaxies (centered on a BCG) and increasing populations of spiral galaxies on the cluster outskirts. Although BOSS1244 is not virialized, we measured the fraction of early-type galaxies as a function of the distance from the quiescent BCG in the upper panel of Fig. 9. When we isolated the strongest bulge-dominated early-type galaxies (n ≥ 3), we found a peaked distribution with a higher fraction of these galaxies near the BCG. This finding supports the results of Shi et al. (2024) that the most strongly-bulge dominated spectroscopic galaxies are within 2′ of the BCG (∼1 Mpc) and that the Hα equivalent width of their spectroscopic sample increases with distance from the BCG, implying that there is some degree of star formation quenching due to the protocluster environment. Moreover, Shi et al. (2024) posited that this local overdensity of early-type galaxies may be indicative of an early-forming red sequence core, similar to the results of Strazzullo et al. (2013) in their z ∼ 2.0 cluster. Although Strazzullo et al. (2013) only found strong evidence of environmental morphological quenching within 200 kpc and our early-type galaxy peak is a factor of 5 times larger, we could be observing BOSS1244 in the early stages of this transformation as the cluster virializes.
Quiescent BCGs are not the only signpost galaxies that can identify galaxy clusters at high-z. Radio-loud AGNs, and quasars specifically, are excellent tracers for high-z structures (e.g., Miley et al. 2006; Galametz et al. 2012; Wylezalek et al. 2013; Paterno-Mahler et al. 2017; Shen et al. 2017; Golden-Marx et al. 2019; Shen et al. 2019; Moravec et al. 2019, 2020; Shen et al. 2020, 2021; Golden-Marx et al. 2021, 2023; Watson et al. 2025a). While there are multiple SDSS-identified spectroscopic quasars as well as HAEs identified as quasars in Shi et al. (2021) in BOSS1244 (see the left panel of Fig. 1 for the locations of the quasars), only two (z = 2.23362 and z = 2.229) fall within our HST coverage (and are thus in the denser part of the protocluster). Given how close these two quasars are, we characterized their environment jointly. We saw a much sharper peak in the distribution of n ≥ 3 bulge-dominated early-type galaxies surrounding the quasars (see the lower panel of Fig. 9). Because the BCG and these quasar are ∼1 Mpc apart and thus the inner regions showing the higher fraction of early-type galaxies contained many overlapping galaxies, however, this might indicate a second potential proto-BCG candidate, similar to the multiple BCG candidates found in Shen et al. (2021), or be additional evidence of the peaked early forming cluster core. Since we found a stronger difference in the fraction of early-type galaxies as a function of the distance from the BCG as compared to the fraction of early-type galaxies as a function of local environment in BOSS1244 (see Fig. 5), this may be evidence that the global environment, as estimated by the distance from the BCG, dominates over the local environment when impacting galaxy evolution and the morphological transformation of protocluster galaxies. It is important to note, however, that the two quasars are a confounding factor to this argument as not all protoclusters host central quasars and it may be a confluence of these two characteristics, and not the BCG alone, that yields the peaked distribution of early-type galaxies.
To determine the potential role quasars play in tracing overdensities of bulge-dominated galaxies in high-z protoclusters, we similarly looked at the quasars in BOSS1542. Unlike BOSS1244, in BOSS1542 (see the right panel of Fig. 1 for the locations of the quasars) none of the quasars showed a peaked distribution of n ≥ 3 early-type galaxies. Therefore, the lack of a central core of early-type galaxies in BOSS1542 and the lack of known quiescent galaxies are further evidence of a difference in the evolutionary state of these two protoclusters despite them being coeval. More importantly, this highlights the challenge in comparing high-z protoclusters; despite similar observed redshifts, we cannot observationally constrain formation redshift to adequately determine evolutionary differences between protocluster systems.
5. Conclusion
Understanding the evolution of galaxy populations within dense environments is key to determining the role of the cluster/protocluster environment in the transformation of high-z star-forming galaxies into their more ubiquitous low-z quiescent early-type red counterparts. Using high-resolution HST WFC3 F160W imaging of BOSS1244 and BOSS1542, we characterized the morphology of a large population of HAEs at z ∼ 2.23. Using GALAPAGOS, we measured the Sérsic index of 80 HAEs in BOSS1244 and 71 HAEs in BOSS1542. We summarize our results below.
-
In comparing the morphology of our samples of protocluster star-forming HAEs with their coeval field counterparts, we found that the morphologies of these galaxies agree very well, without evidence that they are drawn from separate populations. This indicates that the protocluster environment affects the galaxy morphology very little.
-
BOSS1244 showed a slight internal morphology-density trend, with denser regions hosting more early-type galaxies, regardless of our Sérsic index threshold or magnitude cut. In all cases, however, the difference in the population of early-type galaxies is smaller than 1σ and agrees with the field values. Conversely, this positive trend is lacking in some samples for BOSS1542.
-
We identified a large population of multi-peak galaxies that might be mergers and/or clumpy galaxies. All of these galaxies have n < 1.5. We therefore hypothesize that when combined with the large fraction of close-pair galaxies identified in these protoclusters by Liu et al. (2023), this is the buildup of the future population of early-type galaxies.
-
In BOSS1244, we examined the color and distribution of protocluster galaxies, including the spectroscopic sample from Shi et al. (2021) and Shi et al. (2024). While we found no evidence of a large quenched population in the entire system, we found that the strongest bulge-dominated early-type galaxies (n ≥ 3) are clustered close to the quiescent BCG, as well as to two nearby coeval quasars. This core of early-type galaxies might be evidence that the global environment dominates the local environment when the morphological transformation of the protocluster galaxies is affected. The appearance of this clustered early-forming core, along with the previously reported differences in the overall protocluster morphology between BOSS1244 and BOSS1542 (e.g., Zheng et al. 2021; Shi et al. 2021), indicates that BOSS1244 is a more highly evolved protocluster system than BOSS1542.
We successfully measured the fraction of early-type HAEs as a function of density within these two MAMMOTH protoclusters and found little evidence for a local morphology-density relation among the HAEs in the protocluster. To fully trace the morphology-density relation and the buildup of early-type galaxies and to determine the role of virialization and galaxy mergers in this evolution, we require a more complete sampling of the galaxy population. Although the additional spectroscopically confirmed galaxies (including the two quiescent galaxies in BOSS1244) did not change our results, we must account for all protocluster galaxies in the entire structure and not just within the denser regions to accurately trace the impact of the protocluster environment on galaxy morphology, as well as for the lower-mass galaxy populations. More robust observations of MAMMOTH protoclusters are not enough. To determine the importance of dynamical evolution and mergers in the buildup of the morphology-density relation, a larger statistical sample of clusters/protoclusters at 1.5 < z < 4.5 at a range of cluster masses is needed. The success of recent observations from CARLA for a small subset of their high-z structures (e.g., Mei et al. 2023; Afanasiev et al. 2023), the plethora of newly identified high-z (z < 2.0) structures from MaDCoWS-2 (Thongkham et al. 2024), new high-z protostructures (2 < z < 5) from the Charting Cluster Cosmology with ORELSE (C3VO) survey (e.g., Forrest et al. 2023; Shah et al. 2024; Staab et al. 2024; Hung et al. 2025), and soon-to-be-studied high-z clusters and protoclusters observed as part of COSMOS-Web with JWST (e.g., Gozaliasl et al. 2025; Toni et al. 2025a) and observed with Euclid show that a true statistical study of the buildup of the morphology-density relation might be possible in the near future. Furthermore, with the higher angular resolution available with JWST observations, as well as with future telescopes including the Extremely Large Telescope, it will be possible to determine the true effect of merging and/or clumpy galaxies on the transformation of protocluster populations.
Acknowledgments
EGM would like to thank the Anonymous Referee for their useful insights and suggestions during the referee process. EGM would also like to thank Jesse Golden-Marx for reading drafts of this paper and useful discussions regarding SDSS. EGM would like to thank members of the C3VO collaboration for useful discussions on protoclusters and galaxy morphology, and in particular Ekta Shah for useful discussions on galaxy mergers. EGM would also like to thank members of the galaxy evolution group at INAF-OAPd for useful discussions regarding high-z galaxies. EGM would like to thank the High-z group at Tsinghua University for useful discussions regarding protoclusters. Additionally, EGM would like to thank Chien Peng, Michael McDonald, and Song Huang for useful discussions regarding GALFIT and GALAPAGOS. EGM would also like to thank the organizers of the First Structures in the Universe Conference and the Tracing Cosmic Evolution with Galaxy Clusters - V Conference for fostering useful discussions that aided in this work. EGM would like to thank Richard Grumitt, Tom Binney, and Daniele Spinoso for useful discussions. EGM and PR acknowledges the support of this work by the Tsinghua Shui Mu Scholarship. Additionally, EGM, ZC, and PR acknowledge that this work was funded by the National Key R&D Program of China (grant no. 2018YFA0404503), the National Science Foundation of China (grant no. 12073014). The science research grants from the China Manned Space Project with No. CMS-CSST2021-A05, and Tsinghua University Initiative Scientific Research Program (No. 20223080023). DDS acknowledges the support from the National Science Foundation of China (12303015), the National Science Foundation of Jiangsu Province (BK20231106) and the China Manned Space Program with grant No. CMS-CSST- 2025-A20. X. W. is supported by the National Natural Science Foundation of China (grant 12373009), the CAS Project for Young Scientists in Basic Research Grant No. YSBR-062, the Fundamental Research Funds for the Central Universities, the Xiaomi Young Talents Program, and the science research grant from the China Manned Space Project. X. W. also acknowledges work carried out, in part, at the Swinburne University of Technology, sponsored by the ACAMAR visiting fellowship. B.C.L. is supported by the international Gemini Observatory, a program of NSF NOIRLab, which is managed by the Association of Universities for Research in Astronomy (AURA) under a cooperative agreement with the U.S. National Science Foundation, on behalf of the Gemini partnership of Argentina, Brazil, Canada, Chile, the Republic of Korea, and the United States of America. Funding for SDSS-III has been provided by the Alfred P. Sloan Foundation, the Participating Institutions, the National Science Foundation, and the U.S. Department of Energy Office of Science. The SDSS-III web site is http://www.sdss3.org/. SDSS-III is managed by the Astrophysical Research Consortium for the Participating Institutions of the SDSS-III Collaboration including the University of Arizona, the Brazilian Participation Group, Brookhaven National Laboratory, Carnegie Mellon University, University of Florida, the French Participation Group, the German Participation Group, Harvard University, the Instituto de Astrofisica de Canarias, the Michigan State/Notre Dame/JINA Participation Group, Johns Hopkins University, Lawrence Berkeley National Laboratory, Max Planck Institute for Astrophysics, Max Planck Institute for Extraterrestrial Physics, New Mexico State University, New York University, Ohio State University, Pennsylvania State University, University of Portsmouth, Princeton University, the Spanish Participation Group, University of Tokyo, University of Utah, Vanderbilt University, University of Virginia, University of Washington, and Yale University. This research made use of Astropy (http://www.astropy.org) a community-developed core Python package for Astronomy (Astropy Collaboration 2013, 2018).
References
- Afanasiev, A. V., Mei, S., Fu, H., et al. 2023, A&A, 670, A95 [NASA ADS] [CrossRef] [EDP Sciences] [Google Scholar]
- Alberts, S., & Noble, A. 2022, Universe, 8, 554 [Google Scholar]
- Astropy Collaboration (Robitaille, T. P., et al.) 2013, A&A, 558, A33 [NASA ADS] [CrossRef] [EDP Sciences] [Google Scholar]
- Astropy Collaboration (Price-Whelan, A. M., et al.) 2018, AJ, 156, 123 [Google Scholar]
- Balogh, M. L., Navarro, J. F., & Morris, S. L. 2000, ApJ, 540, 113 [Google Scholar]
- Balogh, M. L., van der Burg, R. F. J., Muzzin, A., et al. 2021, MNRAS, 500, 358 [Google Scholar]
- Barden, M., Häußler, B., Peng, C. Y., McIntosh, D. H., & Guo, Y. 2012, MNRAS, 422, 449 [CrossRef] [Google Scholar]
- Barro, G., Faber, S. M., Pérez-González, P. G., et al. 2013, ApJ, 765, 104 [Google Scholar]
- Barro, G., Faber, S. M., Koo, D. C., et al. 2017, ApJ, 840, 47 [Google Scholar]
- Baxter, D. C., Coil, A. L., Nadler, E. O., et al. 2025, ApJ, 990, 225 [Google Scholar]
- Benton, C. E., Nelson, E. J., Miller, T. B., et al. 2024, ApJ, 974, L28 [Google Scholar]
- Bertin, E., & Arnouts, S. 1996, A&AS, 117, 393 [NASA ADS] [CrossRef] [EDP Sciences] [Google Scholar]
- Cai, Z., Fan, X., Peirani, S., et al. 2016, ApJ, 833, 135 [NASA ADS] [CrossRef] [Google Scholar]
- Cai, Z., Fan, X., Bian, F., et al. 2017, ApJ, 839, 131 [NASA ADS] [CrossRef] [Google Scholar]
- Cappellari, M. 2016, ARA&A, 54, 597 [Google Scholar]
- Carnall, A. C., Cullen, F., McLure, R. J., et al. 2024, MNRAS, 534, 325 [NASA ADS] [CrossRef] [Google Scholar]
- Casey, C. M., Cooray, A., Capak, P., et al. 2015, ApJ, 808, L33 [NASA ADS] [CrossRef] [Google Scholar]
- Cassata, P., Tasca, L. A. M., Le Fèvre, O., et al. 2015, A&A, 573, A24 [NASA ADS] [CrossRef] [EDP Sciences] [Google Scholar]
- Cerulo, P., Couch, W. J., Lidman, C., et al. 2016, MNRAS, 457, 2209 [NASA ADS] [CrossRef] [Google Scholar]
- Cerulo, P., Couch, W. J., Lidman, C., et al. 2017, MNRAS, 472, 254 [NASA ADS] [CrossRef] [Google Scholar]
- Chan, J. C. C., Wilson, G., Balogh, M., et al. 2021, ApJ, 920, 32 [NASA ADS] [CrossRef] [Google Scholar]
- Chen, C.-C., Gao, Z.-K., Hsu, Q.-N., et al. 2022, ApJ, 939, L7 [NASA ADS] [CrossRef] [Google Scholar]
- Chiang, Y.-K., Overzier, R. A., Gebhardt, K., & Henriques, B. 2017, ApJ, 844, L23 [Google Scholar]
- Contini, E., De Lucia, G., Hatch, N., Borgani, S., & Kang, X. 2016, MNRAS, 456, 1924 [NASA ADS] [CrossRef] [Google Scholar]
- Coogan, R. T., Daddi, E., Sargent, M. T., et al. 2018, MNRAS, 479, 703 [NASA ADS] [Google Scholar]
- Cooke, E. A., Hatch, N. A., Rettura, A., et al. 2015, MNRAS, 452, 2318 [NASA ADS] [CrossRef] [Google Scholar]
- Cooke, E. A., Hatch, N. A., Stern, D., et al. 2016, ApJ, 816, 83 [NASA ADS] [CrossRef] [Google Scholar]
- Correa, C. A., Schaye, J., & Trayford, J. W. 2019, MNRAS, 484, 4401 [Google Scholar]
- Cucciati, O., Zamorani, G., Lemaux, B. C., et al. 2014, A&A, 570, A16 [NASA ADS] [CrossRef] [EDP Sciences] [Google Scholar]
- Darvish, B., Mobasher, B., Sobral, D., Scoville, N., & Aragon-Calvo, M. 2015, ApJ, 805, 121 [NASA ADS] [CrossRef] [Google Scholar]
- Darvish, B., Mobasher, B., Sobral, D., et al. 2016, ApJ, 825, 113 [NASA ADS] [CrossRef] [Google Scholar]
- Darvish, B., Scoville, N. Z., Martin, C., et al. 2020, ApJ, 892, 8 [NASA ADS] [CrossRef] [Google Scholar]
- de Graaff, A., Setton, D. J., Brammer, G., et al. 2025, Nat. Astron., 9, 280 [Google Scholar]
- De Lucia, G., Fontanot, F., Wilman, D., & Monaco, P. 2011, MNRAS, 414, 1439 [NASA ADS] [CrossRef] [Google Scholar]
- de Vaucouleurs, G. 1948, Ann. Astrophys., 11, 247 [Google Scholar]
- Delahaye, A. G., Webb, T. M. A., Nantais, J., et al. 2017, ApJ, 843, 126 [NASA ADS] [CrossRef] [Google Scholar]
- Di Mascolo, L., Saro, A., Mroczkowski, T., et al. 2023, Nature, 615, 809 [NASA ADS] [CrossRef] [Google Scholar]
- Dressler, A. 1980, ApJ, 236, 351 [Google Scholar]
- Edward, A. H., Balogh, M. L., Bahé, Y. M., et al. 2024, MNRAS, 527, 8598 [Google Scholar]
- Euclid Collaboration (Cleland, C., et al.) 2025, A&A, submitted [arXiv:2503.15313] [Google Scholar]
- Euclid Collaboration (Quilley, L., et al.) 2026, A&A, in press, https://doi.org/10.1051/0004-6361/202554585 [Google Scholar]
- Ferreira, L., Conselice, C. J., Sazonova, E., et al. 2023, ApJ, 955, 94 [NASA ADS] [CrossRef] [Google Scholar]
- Foltz, R., Wilson, G., Muzzin, A., et al. 2018, ApJ, 866, 136 [NASA ADS] [CrossRef] [Google Scholar]
- Forrest, B., Lemaux, B. C., Shah, E., et al. 2023, MNRAS, 526, L56 [NASA ADS] [CrossRef] [Google Scholar]
- Forrest, B., Lemaux, B. C., Shah, E. A., et al. 2024, ApJ, 971, 169 [NASA ADS] [Google Scholar]
- Forrest, B., Shen, L., Lemaux, B. C., et al. 2025, ApJ, 985, 61 [Google Scholar]
- Galametz, A., Stern, D., De Breuck, C., et al. 2012, ApJ, 749, 169 [NASA ADS] [CrossRef] [Google Scholar]
- Giddings, F., Lemaux, B. C., Forrest, B., et al. 2026, A&A, in press, https://doi.org/10.1051/0004-6361/202554407 [Google Scholar]
- Gladders, M. D., & Yee, H. K. C. 2000, AJ, 120, 2148 [NASA ADS] [CrossRef] [Google Scholar]
- Golden-Marx, E., Blanton, E. L., Paterno-Mahler, R., et al. 2019, ApJ, 887, 50 [NASA ADS] [CrossRef] [Google Scholar]
- Golden-Marx, E., Blanton, E. L., Paterno-Mahler, R., et al. 2021, ApJ, 907, 65 [NASA ADS] [CrossRef] [Google Scholar]
- Golden-Marx, E., Moravec, E., Shen, L., et al. 2023, ApJ, 956, 87 [NASA ADS] [CrossRef] [Google Scholar]
- Gonzalez, A. H., Gettings, D. P., Brodwin, M., et al. 2019, ApJS, 240, 33 [NASA ADS] [CrossRef] [Google Scholar]
- Gozaliasl, G., Yang, L., Kartaltepe, J., et al. 2025, A&A, 703, A129 [NASA ADS] [CrossRef] [EDP Sciences] [Google Scholar]
- Grogin, N. A., Kocevski, D. D., Faber, S. M., et al. 2011, ApJS, 197, 35 [NASA ADS] [CrossRef] [Google Scholar]
- Gunn, J. E., Gott, J., & Richard, I. 1972, ApJ, 176, 1 [Google Scholar]
- Hatch, N. A., De Breuck, C., Galametz, A., et al. 2011, MNRAS, 410, 1537 [NASA ADS] [Google Scholar]
- Hatch, N. A., Wylezalek, D., Kurk, J. D., et al. 2014, MNRAS, 445, 280 [NASA ADS] [CrossRef] [Google Scholar]
- Hatch, N. A., Cooke, E. A., Muldrew, S. I., et al. 2017, MNRAS, 464, 876 [Google Scholar]
- Häußler, B., Bamford, S. P., Vika, M., et al. 2013, MNRAS, 430, 330 [Google Scholar]
- Hewitt, G., Sarron, F., Balogh, M. L., et al. 2025, MNRAS, 541, 409 [Google Scholar]
- Hill, R., Chapman, S., Scott, D., et al. 2020, MNRAS, 495, 3124 [NASA ADS] [CrossRef] [Google Scholar]
- Hine, N. K., Geach, J. E., Alexander, D. M., et al. 2016, MNRAS, 455, 2363 [NASA ADS] [CrossRef] [Google Scholar]
- Hung, D., Lemaux, B. C., Cucciati, O., et al. 2025, ApJ, 980, 155 [Google Scholar]
- Jacobs, C., Glazebrook, K., Calabrò, A., et al. 2023, ApJ, 948, L13 [NASA ADS] [CrossRef] [Google Scholar]
- Jin, S., Sillassen, N. B., Magdis, G. E., et al. 2024, A&A, 683, L4 [NASA ADS] [CrossRef] [EDP Sciences] [Google Scholar]
- Kalita, B. S., Suzuki, T. L., Kashino, D., et al. 2025, MNRAS, 536, 3090 [Google Scholar]
- Kartaltepe, J. S., Sanders, D. B., Scoville, N. Z., et al. 2007, ApJS, 172, 320 [NASA ADS] [CrossRef] [Google Scholar]
- Kartaltepe, J. S., Mozena, M., Kocevski, D., et al. 2015, ApJS, 221, 11 [NASA ADS] [CrossRef] [Google Scholar]
- Kartaltepe, J. S., Rose, C., Vanderhoof, B. N., et al. 2023, ApJ, 946, L15 [NASA ADS] [CrossRef] [Google Scholar]
- Kawinwanichakij, L., Papovich, C., Quadri, R. F., et al. 2017, ApJ, 847, 134 [NASA ADS] [CrossRef] [Google Scholar]
- Kawinwanichakij, L., Glazebrook, K., Nanayakkara, T., et al. 2025, arXiv e-prints [arXiv:2505.03089] [Google Scholar]
- Kim, K. J., Bayliss, M. B., Noble, A. G., et al. 2023, ApJ, 955, 32 [CrossRef] [Google Scholar]
- Kiyota, T., Ando, M., Tanaka, M., et al. 2025, ApJ, 980, 104 [Google Scholar]
- Kodra, D., Andrews, B. H., Newman, J. A., et al. 2023, ApJ, 942, 36 [NASA ADS] [CrossRef] [Google Scholar]
- Koekemoer, A. M., Faber, S. M., Ferguson, H. C., et al. 2011, ApJS, 197, 36 [NASA ADS] [CrossRef] [Google Scholar]
- Koyama, Y., Polletta, M. d. C., Tanaka, I., et al. 2021, MNRAS, 503, L1 [NASA ADS] [CrossRef] [Google Scholar]
- Kurk, J. D., Pentericci, L., Röttgering, H. J. A., & Miley, G. K. 2004, A&A, 428, 793 [NASA ADS] [CrossRef] [EDP Sciences] [Google Scholar]
- Larson, R. B., Tinsley, B. M., & Caldwell, C. N. 1980, ApJ, 237, 692 [Google Scholar]
- Lee, J. C., Ly, C., Spitler, L., et al. 2012, PASP, 124, 782 [Google Scholar]
- Lee, J. H., Park, C., Hwang, H. S., & Kwon, M. 2024, ApJ, 966, 113 [NASA ADS] [CrossRef] [Google Scholar]
- Lee-Brown, D. B., Rudnick, G. H., Momcheva, I. G., et al. 2017, ApJ, 844, 43 [Google Scholar]
- Lemaux, B. C., Gal, R. R., Lubin, L. M., et al. 2012, ApJ, 745, 106 [Google Scholar]
- Lemaux, B. C., Tomczak, A. R., Lubin, L. M., et al. 2019, MNRAS, 490, 1231 [NASA ADS] [CrossRef] [Google Scholar]
- Lemaux, B. C., Cucciati, O., Le Fèvre, O., et al. 2022, A&A, 662, A33 [NASA ADS] [CrossRef] [EDP Sciences] [Google Scholar]
- Liu, S., Zheng, X. Z., Shi, D. D., et al. 2023, MNRAS, 523, 2422 [CrossRef] [Google Scholar]
- Liu, S., Zheng, X. Z., Gonzalez, V., et al. 2025, MNRAS, 536, 2000 [Google Scholar]
- Lotz, J. M., Primack, J., & Madau, P. 2004, AJ, 128, 163 [NASA ADS] [CrossRef] [Google Scholar]
- Lotz, J. M., Madau, P., Giavalisco, M., Primack, J., & Ferguson, H. C. 2006, ApJ, 636, 592 [NASA ADS] [CrossRef] [Google Scholar]
- Lotz, J. M., Jonsson, P., Cox, T. J., et al. 2011, ApJ, 742, 103 [Google Scholar]
- Mancone, C. L., & Gonzalez, A. H. 2012, PASP, 124, 606 [NASA ADS] [CrossRef] [Google Scholar]
- Mantz, A. B., Abdulla, Z., Allen, S. W., et al. 2018, A&A, 620, A2 [NASA ADS] [CrossRef] [EDP Sciences] [Google Scholar]
- Marchesini, D., Muzzin, A., Stefanon, M., et al. 2014, ApJ, 794, 65 [NASA ADS] [CrossRef] [Google Scholar]
- McConachie, I., Wilson, G., Forrest, B., et al. 2022, ApJ, 926, 37 [NASA ADS] [CrossRef] [Google Scholar]
- McConachie, I., Wilson, G., Forrest, B., et al. 2025, ApJ, 978, 17 [Google Scholar]
- Mei, S., Hatch, N. A., Amodeo, S., et al. 2023, A&A, 670, A58 [NASA ADS] [CrossRef] [EDP Sciences] [Google Scholar]
- Merlin, E., Fortuni, F., Torelli, M., et al. 2019, MNRAS, 490, 3309 [CrossRef] [Google Scholar]
- Miley, G. K., Overzier, R. A., Zirm, A. W., et al. 2006, ApJ, 650, L29 [NASA ADS] [CrossRef] [Google Scholar]
- Miller, C. J., Nichol, R. C., Reichart, D., et al. 2005, AJ, 130, 968 [Google Scholar]
- Monson, E. B., Lehmer, B. D., Doore, K., et al. 2021, ApJ, 919, 51 [NASA ADS] [CrossRef] [Google Scholar]
- Moravec, E., Gonzalez, A. H., Stern, D., et al. 2019, ApJ, 871, 186 [NASA ADS] [CrossRef] [Google Scholar]
- Moravec, E., Gonzalez, A. H., Stern, D., et al. 2020, ApJ, 888, 74 [Google Scholar]
- Morishita, T., Roberts-Borsani, G., Treu, T., et al. 2023, ApJ, 947, L24 [NASA ADS] [CrossRef] [Google Scholar]
- Mortlock, A., Conselice, C. J., Hartley, W. G., et al. 2013, MNRAS, 433, 1185 [NASA ADS] [CrossRef] [Google Scholar]
- Muldrew, S. I., Hatch, N. A., & Cooke, E. A. 2015, MNRAS, 452, 2528 [NASA ADS] [CrossRef] [Google Scholar]
- Muldrew, S. I., Hatch, N. A., & Cooke, E. A. 2018, MNRAS, 473, 2335 [Google Scholar]
- Muzzin, A., Marchesini, D., Stefanon, M., et al. 2013, ApJ, 777, 18 [NASA ADS] [CrossRef] [Google Scholar]
- Naab, T., Jesseit, R., & Burkert, A. 2006, MNRAS, 372, 839 [NASA ADS] [CrossRef] [Google Scholar]
- Nanayakkara, T., Glazebrook, K., Schreiber, C., et al. 2025, ApJ, 981, 78 [Google Scholar]
- Nantais, J. B., van der Burg, R. F. J., Lidman, C., et al. 2016, A&A, 592, A161 [NASA ADS] [CrossRef] [EDP Sciences] [Google Scholar]
- Nantais, J. B., Muzzin, A., van der Burg, R. F. J., et al. 2017, MNRAS, 465, L104 [Google Scholar]
- Naufal, A., Koyama, Y., Shimakawa, R., & Kodama, T. 2023, ApJ, 958, 170 [NASA ADS] [CrossRef] [Google Scholar]
- Naufal, A., Koyama, Y., D’Eugenio, C., et al. 2024, ApJ, 977, 58 [Google Scholar]
- Noordeh, E., Canning, R. E. A., Willis, J. P., et al. 2021, MNRAS, 507, 5272 [NASA ADS] [CrossRef] [Google Scholar]
- Osborne, C., & Salim, S. 2024, ApJ, 962, 59 [NASA ADS] [CrossRef] [Google Scholar]
- Oteo, I., Sobral, D., Ivison, R. J., et al. 2015, MNRAS, 452, 2018 [NASA ADS] [CrossRef] [Google Scholar]
- Overzier, R. A. 2016, A&ARv, 24, 14 [Google Scholar]
- Paterno-Mahler, R., Blanton, E. L., Brodwin, M., et al. 2017, ApJ, 844, 78 [NASA ADS] [CrossRef] [Google Scholar]
- Peng, C. Y., Ho, L. C., Impey, C. D., & Rix, H.-W. 2002, AJ, 124, 266 [Google Scholar]
- Peng, C. Y., Ho, L. C., Impey, C. D., & Rix, H.-W. 2010a, AJ, 139, 2097 [Google Scholar]
- Peng, Y.-J., Lilly, S. J., Kovač, K., et al. 2010b, ApJ, 721, 193 [Google Scholar]
- Pérez-Martínez, J. M., Dannerbauer, H., Kodama, T., et al. 2023, MNRAS, 518, 1707 [Google Scholar]
- Peter, A. H. G., Shapley, A. E., Law, D. R., et al. 2007, ApJ, 668, 23 [Google Scholar]
- Popesso, P., Concas, A., Cresci, G., et al. 2023, MNRAS, 519, 1526 [Google Scholar]
- Postman, M., Franx, M., Cross, N. J. G., et al. 2005, ApJ, 623, 721 [Google Scholar]
- Quilis, V., Moore, B., & Bower, R. 2000, Science, 288, 1617 [Google Scholar]
- Ribeiro, B., Le Fèvre, O., Cassata, P., et al. 2017, A&A, 608, A16 [NASA ADS] [CrossRef] [EDP Sciences] [Google Scholar]
- Roberts, I. D., Parker, L. C., Brown, T., et al. 2019, ApJ, 873, 42 [CrossRef] [Google Scholar]
- Rodriguez-Gomez, V., Sales, L. V., Genel, S., et al. 2017, MNRAS, 467, 3083 [Google Scholar]
- Rudnick, G. H., Tran, K.-V., Papovich, C., Momcheva, I., & Willmer, C. 2012, ApJ, 755, 14 [Google Scholar]
- Rykoff, E. S., Rozo, E., Busha, M. T., et al. 2014, ApJ, 785, 104 [Google Scholar]
- Sampaio, V. M., de Carvalho, R. R., Aragón-Salamanca, A., et al. 2024, MNRAS, 532, 982 [NASA ADS] [CrossRef] [Google Scholar]
- Sazonova, E., Alatalo, K., Lotz, J., et al. 2020, ApJ, 899, 85 [Google Scholar]
- Sérsic, J. L. 1963, Boletin de la Asociacion Argentina de Astronomia La Plata Argentina, 6, 41 [Google Scholar]
- Shah, E. A., Lemaux, B., Forrest, B., et al. 2024, MNRAS, 529, 873 [NASA ADS] [CrossRef] [Google Scholar]
- Shen, L., Miller, N. A., Lemaux, B. C., et al. 2017, MNRAS, 472, 998 [NASA ADS] [CrossRef] [Google Scholar]
- Shen, L., Tomczak, A. R., Lemaux, B. C., et al. 2019, MNRAS, 484, 2433 [Google Scholar]
- Shen, L., Liu, G., Zhang, M.-F., et al. 2020, ApJ, 902, 101 [Google Scholar]
- Shen, L., Lemaux, B. C., Lubin, L. M., et al. 2021, ApJ, 912, 60 [NASA ADS] [CrossRef] [Google Scholar]
- Shen, L., Papovich, C., Matharu, J., et al. 2024, ApJ, 963, L49 [NASA ADS] [CrossRef] [Google Scholar]
- Shi, D. D., Cai, Z., Fan, X., et al. 2021, ApJ, 915, 32 [NASA ADS] [CrossRef] [Google Scholar]
- Shi, D. D., Wang, X., Zheng, X. Z., et al. 2024, ApJ, 963, 21 [NASA ADS] [CrossRef] [Google Scholar]
- Shibuya, T., Ouchi, M., Kubo, M., & Harikane, Y. 2016, ApJ, 821, 72 [NASA ADS] [CrossRef] [Google Scholar]
- Shibuya, T., Ito, Y., Asai, K., et al. 2025, PASJ, 77, 21 [Google Scholar]
- Shimakawa, R., Kodama, T., Hayashi, M., et al. 2018a, MNRAS, 473, 1977 [NASA ADS] [CrossRef] [Google Scholar]
- Shimakawa, R., Koyama, Y., Röttgering, H. J. A., et al. 2018b, MNRAS, 481, 5630 [NASA ADS] [CrossRef] [Google Scholar]
- Shuntov, M., Akins, H. B., Paquereau, L., et al. 2025a, A&A, 704, A339 [NASA ADS] [CrossRef] [EDP Sciences] [Google Scholar]
- Shuntov, M., Ilbert, O., Lagos, C. d. P., et al. 2025b, A&A, submitted [arXiv:2511.05259] [Google Scholar]
- Smethurst, R. J., Simmons, B. D., Géron, T., et al. 2025, MNRAS, 539, 1359 [Google Scholar]
- Snyder, G. F., Lotz, J. M., Rodriguez-Gomez, V., et al. 2017, MNRAS, 468, 207 [NASA ADS] [CrossRef] [Google Scholar]
- Staab, P., Lemaux, B. C., Forrest, B., et al. 2024, MNRAS, 528, 6934 [NASA ADS] [CrossRef] [Google Scholar]
- Strazzullo, V., Gobat, R., Daddi, E., et al. 2013, ApJ, 772, 118 [NASA ADS] [CrossRef] [Google Scholar]
- Strazzullo, V., Pannella, M., Mohr, J. J., et al. 2023, A&A, 669, A131 [NASA ADS] [CrossRef] [EDP Sciences] [Google Scholar]
- Tanaka, M., Onodera, M., Shimakawa, R., et al. 2024, ApJ, 970, 59 [Google Scholar]
- Thongkham, K., Gonzalez, A. H., Brodwin, M., et al. 2024, ApJ, 976, 186 [Google Scholar]
- Tomczak, A. R., Lemaux, B. C., Lubin, L. M., et al. 2019, MNRAS, 484, 4695 [Google Scholar]
- Toni, G., Gozaliasl, G., Maturi, M., et al. 2025a, A&A, 697, A197 [NASA ADS] [CrossRef] [EDP Sciences] [Google Scholar]
- Toni, G., Maturi, M., Castignani, G., et al. 2025b, A&A, submitted [arXiv:2509.08040] [Google Scholar]
- Toomre, A. 1977, in Evolution of Galaxies and Stellar Populations, eds. B. M. Tinsley, R. B. G. Larson, & D. Campbell, 401 [Google Scholar]
- Toshikawa, J., Malkan, M. A., Kashikawa, N., et al. 2020, ApJ, 888, 89 [Google Scholar]
- Treu, T., Calabrò, A., Castellano, M., et al. 2023, ApJ, 942, L28 [CrossRef] [Google Scholar]
- Umehata, H., Fumagalli, M., Smail, I., et al. 2019, Science, 366, 97 [Google Scholar]
- Umehata, H., Kubo, M., Smail, I., et al. 2025, arXiv e-prints [arXiv:2502.01868] [Google Scholar]
- van der Wel, A., Bell, E. F., Häussler, B., et al. 2012, ApJS, 203, 24 [NASA ADS] [CrossRef] [Google Scholar]
- van der Wel, A., Martorano, M., Häußler, B., et al. 2024, ApJ, 960, 53 [NASA ADS] [CrossRef] [Google Scholar]
- Vulcani, B., Poggianti, B. M., Aragón-Salamanca, A., et al. 2011a, MNRAS, 412, 246 [Google Scholar]
- Vulcani, B., Poggianti, B. M., Dressler, A., et al. 2011b, MNRAS, 413, 921 [NASA ADS] [CrossRef] [Google Scholar]
- Vulcani, B., Marchesini, D., De Lucia, G., et al. 2016, ApJ, 816, 86 [NASA ADS] [CrossRef] [Google Scholar]
- Vulcani, B., Poggianti, B. M., Gullieuszik, M., et al. 2023, ApJ, 949, 73 [CrossRef] [Google Scholar]
- Wang, X., Li, Z., Cai, Z., et al. 2022, ApJ, 926, 70 [NASA ADS] [CrossRef] [Google Scholar]
- Watson, C., Tran, K.-V., Tomczak, A., et al. 2019, ApJ, 874, 63 [NASA ADS] [CrossRef] [Google Scholar]
- Watson, C. B., Blanton, E. L., Golden-Marx, E., et al. 2025a, ApJ, 984, 57 [Google Scholar]
- Watson, P. J., Vulcani, B., Treu, T., et al. 2025b, A&A, 699, A225 [NASA ADS] [CrossRef] [EDP Sciences] [Google Scholar]
- Werner, S. V., Hatch, N. A., Muzzin, A., et al. 2022, MNRAS, 510, 674 [Google Scholar]
- Willis, J. P., Canning, R. E. A., Noordeh, E. S., et al. 2020, Nature, 577, 39 [NASA ADS] [CrossRef] [Google Scholar]
- Wing, J. D., & Blanton, E. L. 2011, AJ, 141, 88 [CrossRef] [Google Scholar]
- Wylezalek, D., Galametz, A., Stern, D., et al. 2013, ApJ, 769, 79 [NASA ADS] [CrossRef] [Google Scholar]
- Zhang, Y., Zheng, X. Z., Shi, D. D., et al. 2022, MNRAS, 512, 4893 [NASA ADS] [CrossRef] [Google Scholar]
- Zheng, X. Z., Cai, Z., An, F. X., Fan, X., & Shi, D. D. 2021, MNRAS, 500, 4354 [Google Scholar]
- Zhou, H., Wang, X., Malkan, M. A., et al. 2025, ApJ, 993, 231 [Google Scholar]
- Zolotov, A., Dekel, A., Mandelker, N., et al. 2015, MNRAS, 450, 2327 [Google Scholar]
Although we used 300 kpc in this work, we measured the difference in environment using regions between 200 kpc and 800 kpc and ultimately chose 300 kpc because of the clearest measurement of HAEs in low and high-density regions that allowed for two similarly-sized density bins.
Appendix A: BOSS1441
Although this paper focused on our analysis of the morphology of HAEs in BOSS1244 and BOSS1542, we have additional HST imaging of BOSS1441, another MAMMOTH protocluster at z ∼ 2.32 (Cai et al. 2017). Unlike BOSS1244 and BOSS1542, which are characterized by overdensities of HAEs, BOSS1441 was identified via an overdensity of LAEs (10.8±1.0 LAEs in a 15 Mpc3 region Cai et al. 2017). These LAEs were identified using deep narrowband imaging in the NB403 filter taken with the MOSAIC1.1 Camera on the 4 m Mayall Telescope at Kitt Peak. Cai et al. (2017) reported 99 LAEs in the BOSS1441 protocluster structure. Similar to our pointings for BOSS1244 and BOSS1542, we only observed the densest regions of the protocluster, which yields our 9 HST pointings, including 28 LAEs (see Fig. A.1 for the HST coverage of our LAEs).
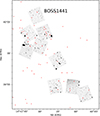 |
Fig. A.1. Coverage by the HST pointings of BOSS1441. As in Fig. 1, we present our HST WFC3 F160W images and the overlaid red circular regions denote the LAEs (BOSS1441). The total area shown for BOSS1441 is ∼ 13 |

We ultimately focused on BOSS1244 and BOSS1542 in this analysis and not BOSS1441 because of the larger sample of HAEs in the other two protoclusters as well as the representative nature of HAEs as typical star-forming galaxies. As mentioned previously, at z > 2, star-forming galaxies are the dominant population (e.g., Muzzin et al. 2013; Marchesini et al. 2014; Edward et al. 2024) and HAEs span a similar phase space in terms of their stellar mass, SFR, and color to typical star-forming galaxies (Oteo et al. 2015). Unlike the ubiquitous results for HAEs, Oteo et al. (2015) found that only 4.5% of HAEs are LAEs and that LAEs probed a bluer lower stellar mass subset of star-forming galaxies. Additionally, Cassata et al. (2015) found that only ∼ 10% of the star-forming galaxies in the VIMOS Ultra Deep Survey are strong LAEs at z ∼ 2.3, further emphasizing their bias. Thus, although a sample of LAEs can obviously be used to identify an overdensity (e.g., Cai et al. 2017; Umehata et al. 2019), it is a biased population, making it difficult to characterize the evolution of protocluster galaxies as a whole. While we included our analysis of the morphology of LAEs as a function of the environment in BOSS1441 here, we did not include it in the main paper because we cannot place rigorous constraints on the morphology of the protocluster galaxies relative to the field.
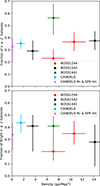 |
Fig. A.2. Morphology-density relation in all three MAMMOTH protoclusters. BOSS1244 is shown in red. BOSS1542 is shown in black. BOSS1441 is shown in green. With the exception of the additional point for BOSS1441, the figure is identical to Fig. 5. As in Fig. 5, the values of the fractions of galaxies with n ≥ 2 for each sample is measured by bootstrapping over the measured errors in Sérsic index over 1000 iterations. |
Unlike the populations of HAEs in BOSS1244 and BOSS1542, we did not have a large population of LAEs. Rather, only 28 LAEs were covered by our HST coverage and we only had successful GALAPAGOS measurements for 18 of these galaxies. Thus, we did not have a large enough sample to estimate galaxy density in multiple bins. However, we found an abundance of galaxies with n ≥ 2 (see Fig. A.2). This places the overall fraction of early-type galaxies above the lower density bins for BOSS1244 and BOSS1542 and also approximately 1σ above the field (and ∼ 1σ above the higher density bins in BOSS1244 and BOSS1542). Interestingly, this seems to be primarily among the fainter galaxies given the similarities to the values in BOSS1441 and the lower density bins in the brighter sample (although the error bars are quite large). This may also reflect the biases discussed in Oteo et al. (2015) regarding LAEs probing fainter galaxies at z ∼ 2.3. If the abundance of early-type galaxies is real, this could indicate that BOSS1441 is a more evolved protocluster system, at least in regards to its galaxy population. Interestingly, this result is echoed in the analysis of the spatial distribution of protocluster galaxies in Shi et al. (2021), who noted that of all three MAMMOTH protoclusters mentioned in this paper, BOSS1441 shows the least substructure and includes only a singular, relatively symmetric distribution of galaxies. Because LAEs are not ubiquitous and we only have a small sample with large error bars, it is difficult to make any strong conclusions. Additionally, it is interesting to note that while we identified multiple potential interacting galaxies, only one is a multi-peak system, which could suggest that this system is farther along its evolutionary path.
Appendix B: GALAPAGOS fittings
As part of the measurements of the Sérsic index, GALFIT and GALAPAGOS create models of single-component Sérsic galaxies, which are then subtracted from the source image. We included examples of the resulting residuals to show the goodness of these fits (see Fig. B.1). For the overwhelming majority of these sources, we find little evidence of substructure among the residuals, pointing to the effectiveness of fitting these galaxies using a single-component Sérsic index with GALAPAGOS, even for the multi-peak galaxies.
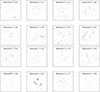 |
Fig. B.1. Residuals output from GALAPAGOS. Each figure shows an ∼ 2 |


Appendix C: The statistical coeval field sample
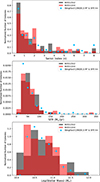 |
Fig. C.1. Comparisons of the statistical coeval field sample to each protocluster. In each plot, we examine the normalized distribution of various galaxy properties — the Sérsic index (top), SFR (middle), and Log(Stellar Mass) (bottom) — in comparison to the distribution in each protocluster. Because each coeval field galaxy has a weighted likelihood of being in our redshift range (2.246 ± 0.02), the points for the coeval field sample represent the weighted likelihood of each galaxy with a given Sérsic index, stellar mass, and SFR being in a given bin. |
As discussed in Sect. 2.4, we constructed a coeval background field consisting of galaxies in CANDELS with Sérsic indices measured in van der Wel et al. (2012). To statistically show that the coeval field sample is similar to our protocluster samples in terms of stellar mass and SFR (see Fig. C.1), we did a KS-test to compare the Sérsic indices, stellar masses, and SFRs between the coeval field sample and each protocluster. For the coeval field sample, we created a statistical distribution that weighted the likelihood that each galaxy (with a given Sérsic index, stellar mass, and SFR) is at the target redshift (2.246 ± 0.02). It is the weighted distribution of the background that we compared to the protoclusters in Fig. C.1. As seen in each case, we find strong agreement between the coeval field and the protocluster samples, implying that the field is not biasing our results. For the Sérsic index, we find (P1244 − Field = 0.83, P1542 − Field = 0.98). For the SFR, we find (P1244 − Field = 0.80, P1542 − Field = 0.79). For the stellar mass, we find (P1244 − Field = 1.0, P1542 − Field = 0.99). All of the KS P values indicated that there is no evidence that these sources are drawn from separate samples.
Appendix D: Examining faint galaxies in the BOSS1244 color-magnitude diagram
As mentioned in Sect. 4.3, we examined the population of galaxies in BOSS1244 observed with HST WFC3 F160W and F125W to explore the existence of a red sequence population. While we found no evidence for a potential red sequence population among the HAEs, we did note a number of sources that are brighter than the magnitude limit in F160W, but below our analysis criterion in F125W. We included detections as the upward pointing triangles in Fig. D.1. These galaxies may represent a sample of extremely dusty HAEs. Their faint detection makes it difficult to fully characterize them at this time, however, and will require additional observations.
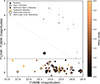 |
Fig. D.1. Color-magnitude diagram for BOSS1244 including the lower limit detections. The legend is identical to Fig. 8, except we included a subset of galaxies detected in F160W, but not detected above our magnitude limit in F125W. We have included an estimate of their color shown in upward pointing triangles. As in Fig. 8, the pink dot-dashed line marks our detection limit relative to the galaxies below our detection limit in F125W. |
All Tables
All Figures
|
Fig. 1. Coverage by the HST pointings of the MAMMOTH protoclusters, BOSS1244 (left) and BOSS1542 (right). In each panel we present our HST WFC3 F160W images. The overlaid circular red regions denote the HAEs. The overlaid circular cyan regions denote HAEs that were spectroscopically confirmed by Shi et al. (2021) and fall within the larger HST footprint (a few lie beyond the coverage region). In the left panel, the galaxies that were spectroscopically confirmed via HST grism observations are overlaid as magenta squares. Similarly, the quiescent galaxies identified by Shi et al. (2024) are shown as blue squares. In BOSS1244 and BOSS1542, the SDSS-identified coeval quasars in each field are shown as purple squares. Some of these quasars were previously identified as HAEs. In BOSS1244 and BOSS1542, the densest regions are found in the lower right quadrant with HST coverage. The total area shown for BOSS1244 and BOSS1542 is ∼12′ × 17′. |
| In the text | |
|
Fig. 2. Image cutouts of HST WFC3 F160W detected HAEs in BOSS1244 (top row) and BOSS1542 (bottom row). A selection of early-type galaxies are shown in the left two columns and a selection of late-type galaxies are shown in the right two columns. The Sérsic index of each galaxy is included at the top of each cutout. Each cutout is 2 |
| In the text | |
|
Fig. 3. Image cutouts of a selection of HST WFC3 F160W detected multi-peak galaxies identified in BOSS1244 (top row) and BOSS1542 (bottom row). Each cutout is 2 |
| In the text | |
|
Fig. 4. Star formation rate as a function of stellar mass for our samples of HAEs from BOSS1244 and BOSS1542 overplotted on the coeval sample of field galaxies with SFRs and stellar masses from Osborne & Salim (2024) in the CANDELS fields. The color of the coeval field sample galaxy represents the likelihood that a given galaxy is at z = 2.246 ± 0.02 based on the photometric redshifts from Kodra et al. (2023). We overplotted an estimate of the star formation main sequence at z = 2.23 based on the analysis in Popesso et al. (2023) in green. Because the star formation main sequence is calibrated using a Kroupa IMF, we converted the star formation rates and stellar masses to reflect the Chabrier IMF used in Osborne & Salim (2024). Although we measured the likelihood that all galaxies, regardless of the median redshift estimate are at z = 2.246, in the above plot, we only included those galaxies with a median photometric redshift (or spectroscopic redshift) of 2 < z < 3. The vertical line represents the 90% stellar mass completeness limit for BOSS1244 and BOSS1542 (1010.3 M⊙) based on the analysis in Liu et al. (2023). The horizontal line shows our estimate of the SFR completeness limit (20 M⊙/yr). |
| In the text | |
|
Fig. 5. Morphology-density relation in two MAMMOTH protoclusters, BOSS1244 (in red) and BOSS1542 (in black). The weighted CANDELS field is shown in blue and the CANDELS stellar mass and SFR sample (CANDELS M* & SFR lim) is shown in magenta. Top: All detected galaxies brighter than our magnitude threshold (mF160W ≤ 24.5). Bottom: All detected galaxies brighter than m*+1, where m* is the modeled magnitude of an L* galaxy at z = 2.246 estimated using EzGal (i.e., mF160W ≤ 23.36 magnitudes; Mancone & Gonzalez 2012). In each plot, the density measurement is for the entire sample. The value of the fraction of galaxies with n ≥ 2 for each sample is measured by bootstrapping over the measured errors in Sérsic index over 1000 iterations. We found evidence for an internal morphology-density trend in both protoclusters among all galaxies, but no evidence for an enhancement of the early-type fraction relative to the field. The brighter galaxies in each protocluster differed, however, with the denser regions of BOSS1542 having fewer early-type massive galaxies. |
| In the text | |
|
Fig. 6. Morphology-density relation in BOSS1244 and BOSS1542 for strongly bulge-dominated galaxies (n ≥ 3). The same legend is used as in Fig. 5. Top: All detected galaxies brighter than our magnitude limit (mF160W < 24.5). Bottom: All detected galaxies brighter than an m*+1 galaxy at z = 2.246. In each plot, the density measurement is for the entire sample. As in Fig. 5, the value of the fraction of galaxies with n ≥ 3 for each sample is measured by bootstrapping over the measured errors in Sérsic index over 1000 iterations. Here, we see a local morphology-density relation in BOSS1244, but no such relation in BOSS1542, pointing to differences in the evolutionary states of these protoclusters. |
| In the text | |
|
Fig. 7. Top: Merger-density relation for the multi-peak galaxies in two MAMMOTH protoclusters. Bottom: Histogram of the Sérsic indices of multi-peak galaxies. As previously noted, BOSS1244 is shown in red and BOSS1542 is shown in black. The density measurements are identical to those found in Figs. 5 and 6. |
| In the text | |
|
Fig. 8. Color-magnitude diagram for BOSS1244. The HAEs are shown in circles. The spectroscopically-confirmed HAEs have a diamond surrounding them. The multi-peak galaxies have a hexagon surrounding them. The additional spectroscopic star-forming galaxies from HST grism are shown by a plus sign. The quiescent galaxies are shown in squares. The horizontal dashed line shows the color of a modeled red sequence galaxy based on EzGal models (Mancone & Gonzalez 2012) for a galaxy at z = 2.246. The pink dot-dashed line shows the magnitude limit for our analysis. The color of each point is based on the Sérsic index; late-type galaxies are darker and early-type galaxies are more orange. |
| In the text | |
|
Fig. 9. Fraction of strongly bulge-dominated early-type galaxies (n ≥ 3) as a function of the distance from the BCG (top) and the distance from two quasars (one quasar at z = 2.236, and the other at z = 2.229; bottom). The quiescent BCG and the two quasars are ∼1 Mpc apart. In both cases, we found a peak in the distribution of n ≥ 3 bulge dominated galaxies near the target galaxy, with the BCG showing a less steep distribution. |
| In the text | |
|
Fig. A.1. Coverage by the HST pointings of BOSS1441. As in Fig. 1, we present our HST WFC3 F160W images and the overlaid red circular regions denote the LAEs (BOSS1441). The total area shown for BOSS1441 is ∼ 13 |
| In the text | |
|
Fig. A.2. Morphology-density relation in all three MAMMOTH protoclusters. BOSS1244 is shown in red. BOSS1542 is shown in black. BOSS1441 is shown in green. With the exception of the additional point for BOSS1441, the figure is identical to Fig. 5. As in Fig. 5, the values of the fractions of galaxies with n ≥ 2 for each sample is measured by bootstrapping over the measured errors in Sérsic index over 1000 iterations. |
| In the text | |
|
Fig. B.1. Residuals output from GALAPAGOS. Each figure shows an ∼ 2 |
| In the text | |
|
Fig. C.1. Comparisons of the statistical coeval field sample to each protocluster. In each plot, we examine the normalized distribution of various galaxy properties — the Sérsic index (top), SFR (middle), and Log(Stellar Mass) (bottom) — in comparison to the distribution in each protocluster. Because each coeval field galaxy has a weighted likelihood of being in our redshift range (2.246 ± 0.02), the points for the coeval field sample represent the weighted likelihood of each galaxy with a given Sérsic index, stellar mass, and SFR being in a given bin. |
| In the text | |
|
Fig. D.1. Color-magnitude diagram for BOSS1244 including the lower limit detections. The legend is identical to Fig. 8, except we included a subset of galaxies detected in F160W, but not detected above our magnitude limit in F125W. We have included an estimate of their color shown in upward pointing triangles. As in Fig. 8, the pink dot-dashed line marks our detection limit relative to the galaxies below our detection limit in F125W. |
| In the text | |
Current usage metrics show cumulative count of Article Views (full-text article views including HTML views, PDF and ePub downloads, according to the available data) and Abstracts Views on Vision4Press platform.
Data correspond to usage on the plateform after 2015. The current usage metrics is available 48-96 hours after online publication and is updated daily on week days.
Initial download of the metrics may take a while.