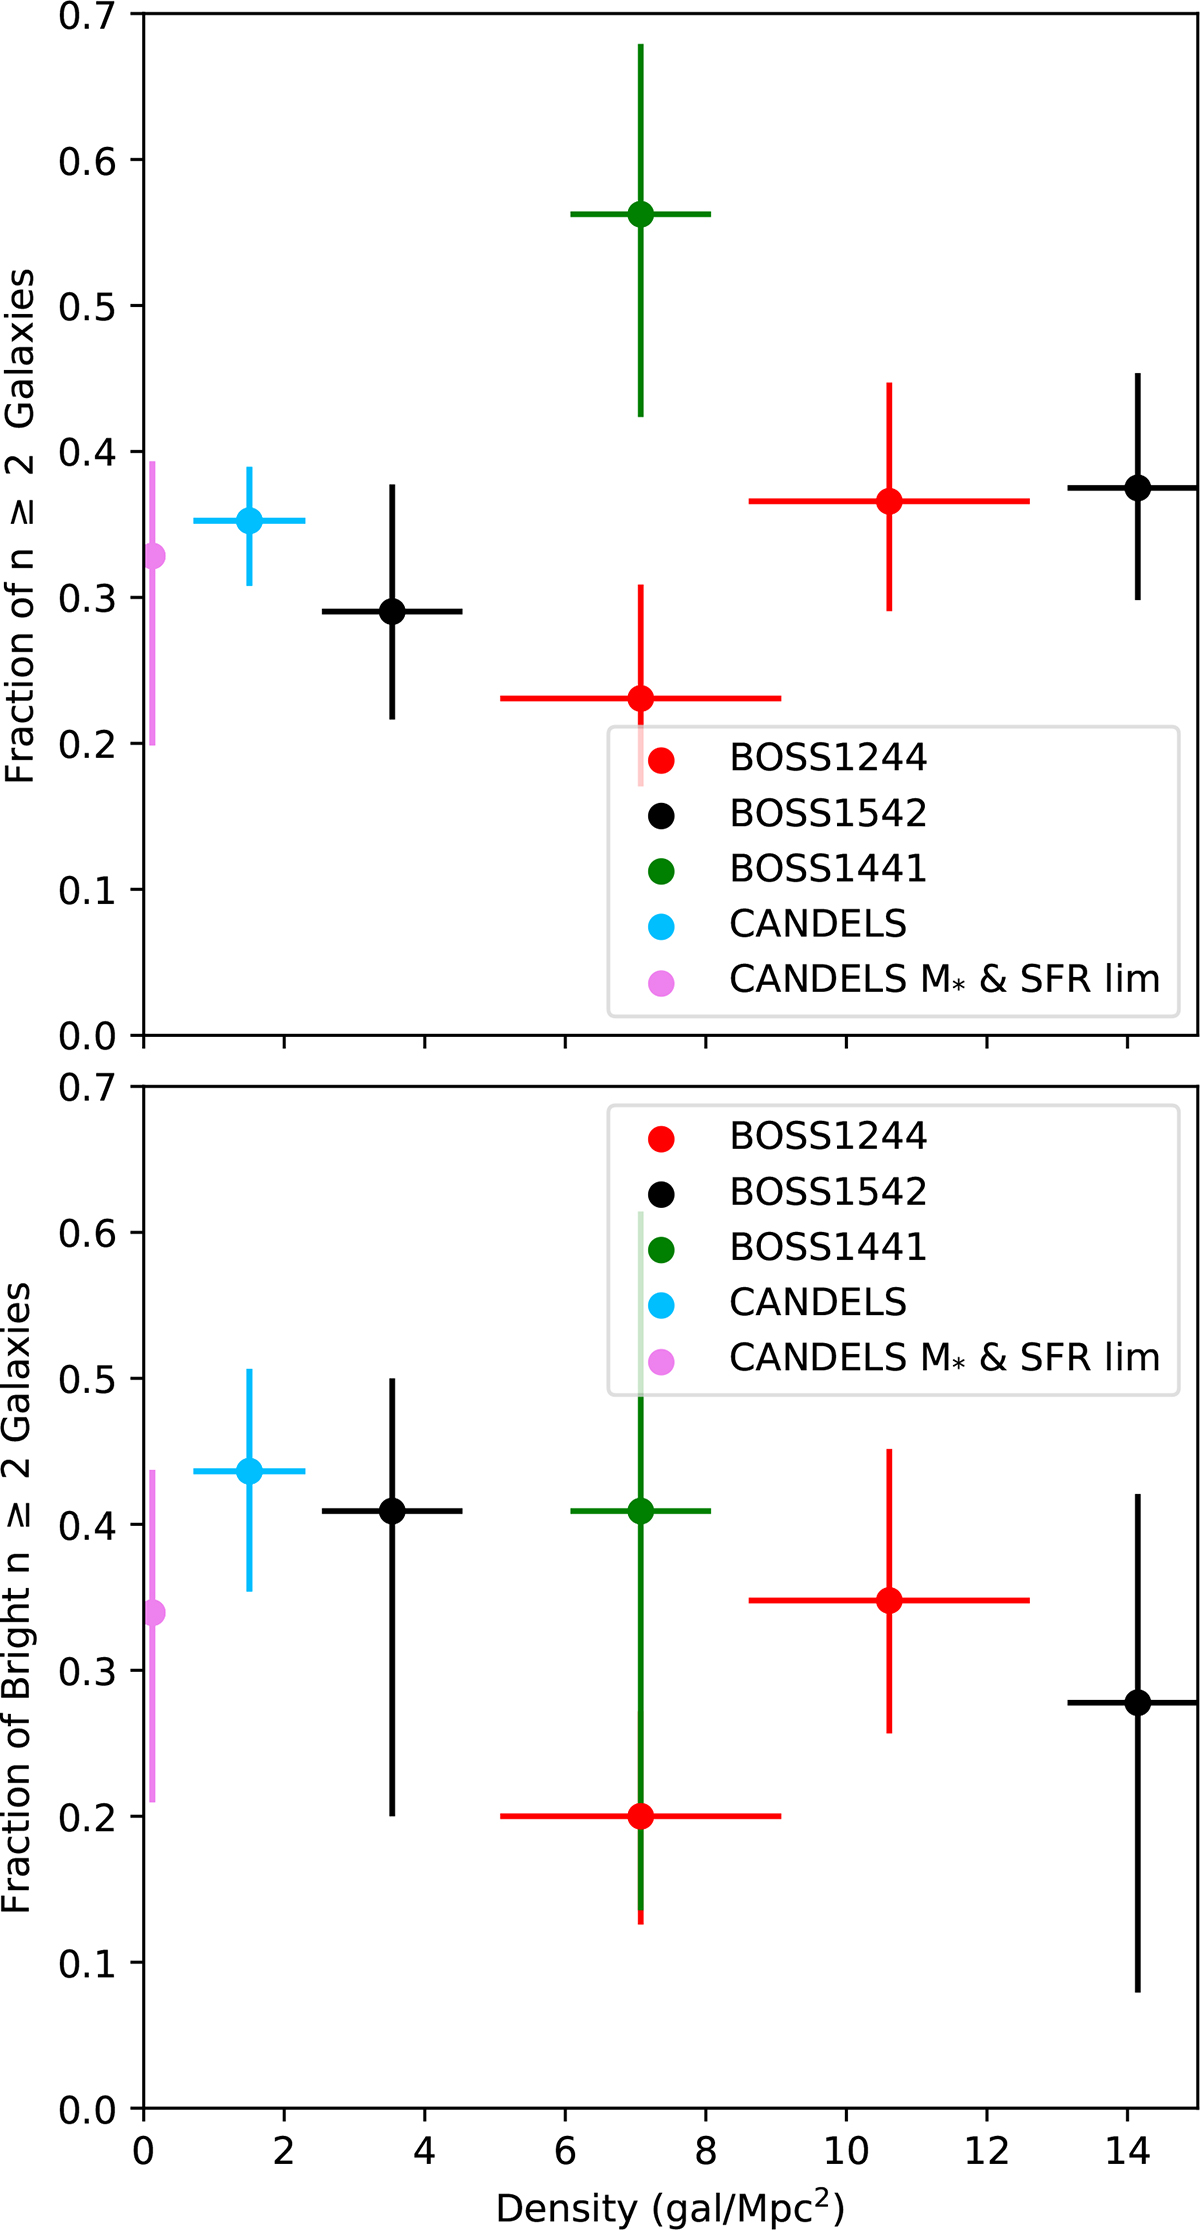
Fig. A.2.
Download original image
Morphology-density relation in all three MAMMOTH protoclusters. BOSS1244 is shown in red. BOSS1542 is shown in black. BOSS1441 is shown in green. With the exception of the additional point for BOSS1441, the figure is identical to Fig. 5. As in Fig. 5, the values of the fractions of galaxies with n ≥ 2 for each sample is measured by bootstrapping over the measured errors in Sérsic index over 1000 iterations.
Current usage metrics show cumulative count of Article Views (full-text article views including HTML views, PDF and ePub downloads, according to the available data) and Abstracts Views on Vision4Press platform.
Data correspond to usage on the plateform after 2015. The current usage metrics is available 48-96 hours after online publication and is updated daily on week days.
Initial download of the metrics may take a while.