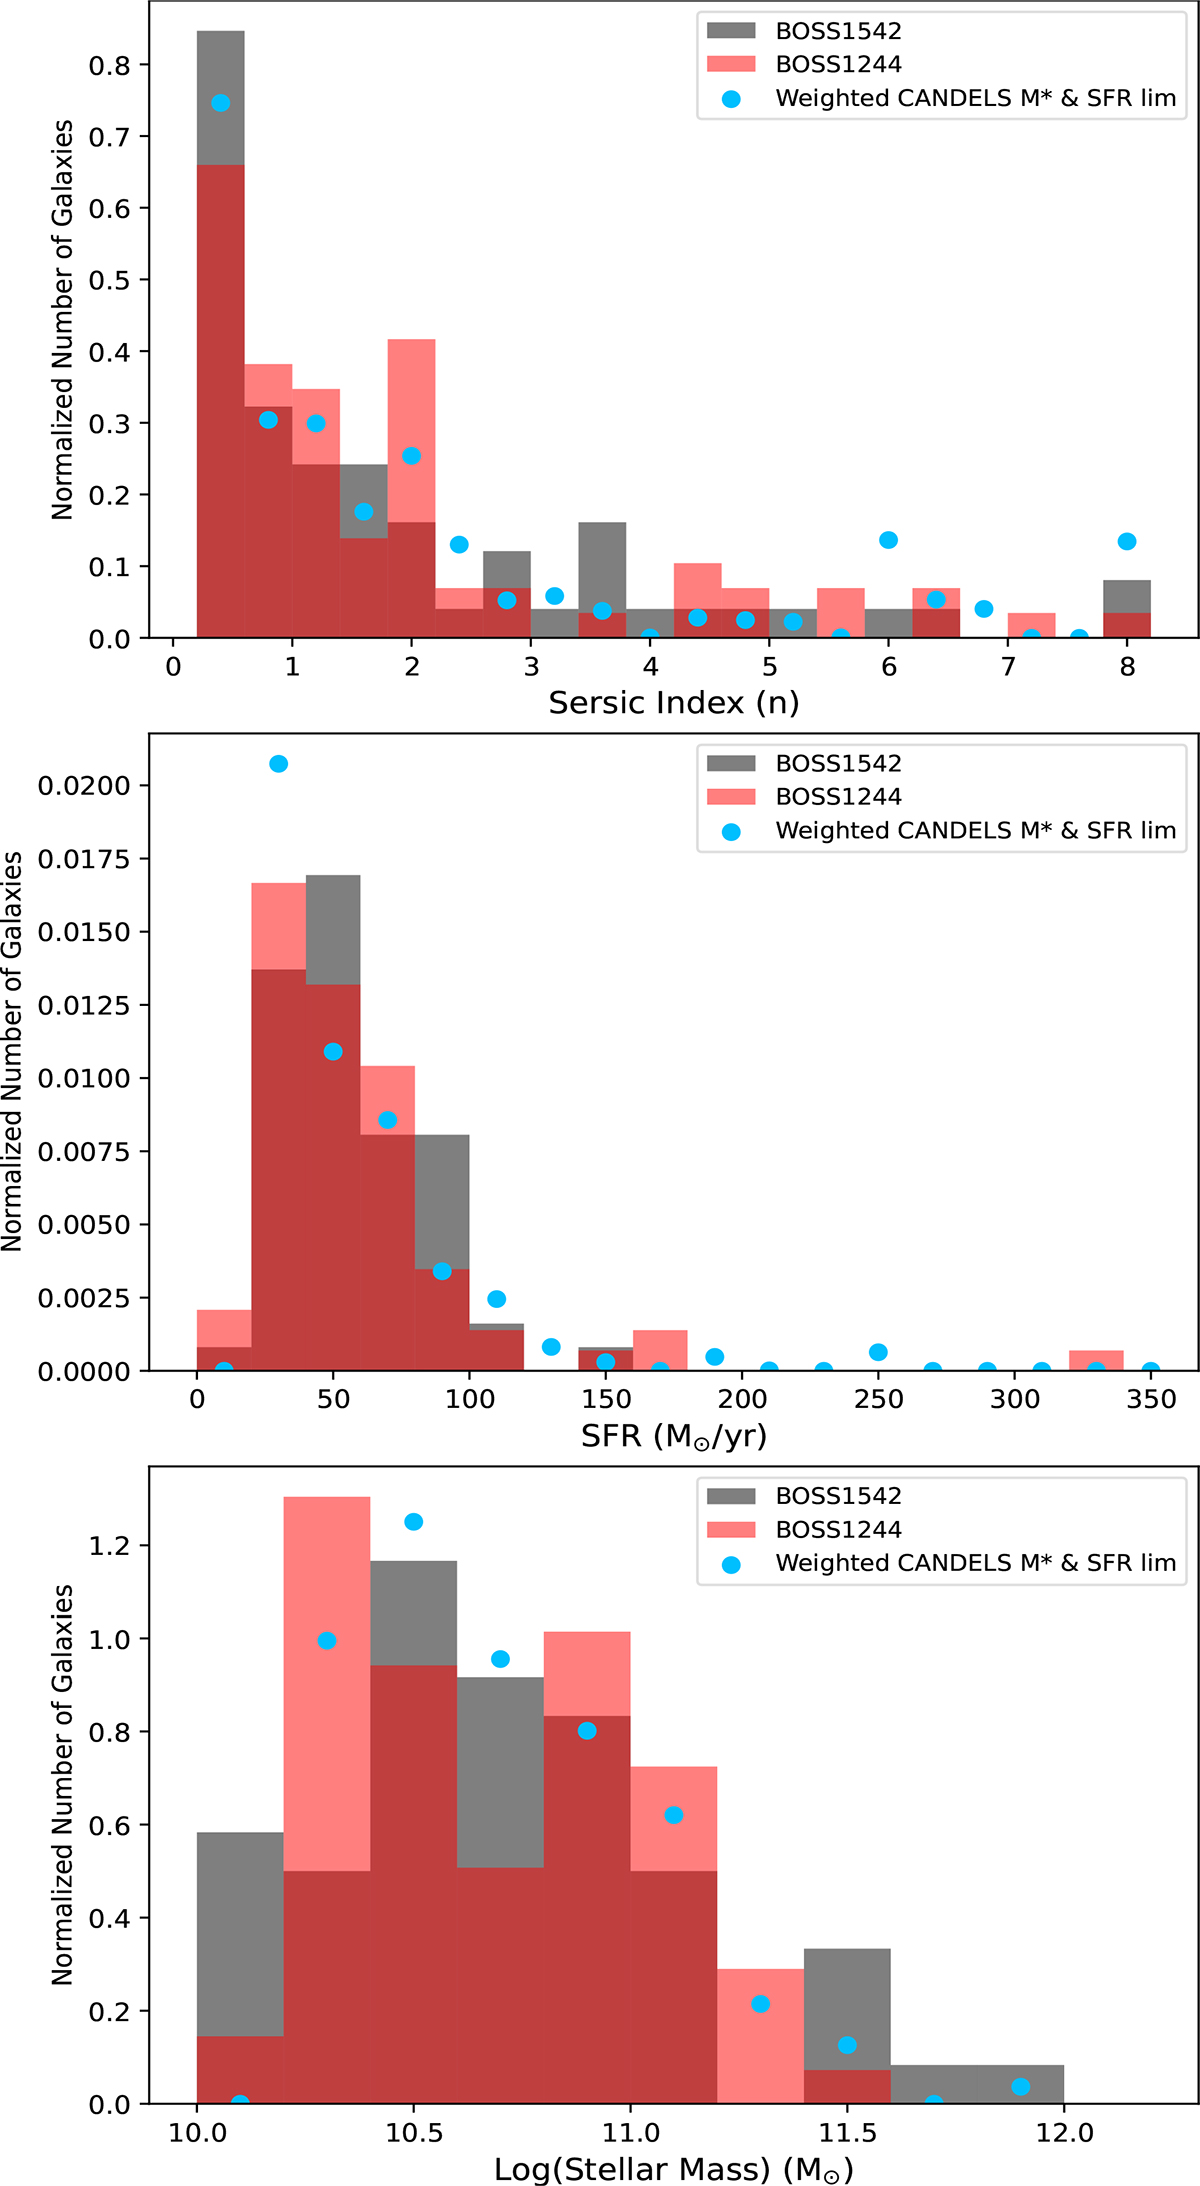
Fig. C.1.
Download original image
Comparisons of the statistical coeval field sample to each protocluster. In each plot, we examine the normalized distribution of various galaxy properties — the Sérsic index (top), SFR (middle), and Log(Stellar Mass) (bottom) — in comparison to the distribution in each protocluster. Because each coeval field galaxy has a weighted likelihood of being in our redshift range (2.246 ± 0.02), the points for the coeval field sample represent the weighted likelihood of each galaxy with a given Sérsic index, stellar mass, and SFR being in a given bin.
Current usage metrics show cumulative count of Article Views (full-text article views including HTML views, PDF and ePub downloads, according to the available data) and Abstracts Views on Vision4Press platform.
Data correspond to usage on the plateform after 2015. The current usage metrics is available 48-96 hours after online publication and is updated daily on week days.
Initial download of the metrics may take a while.