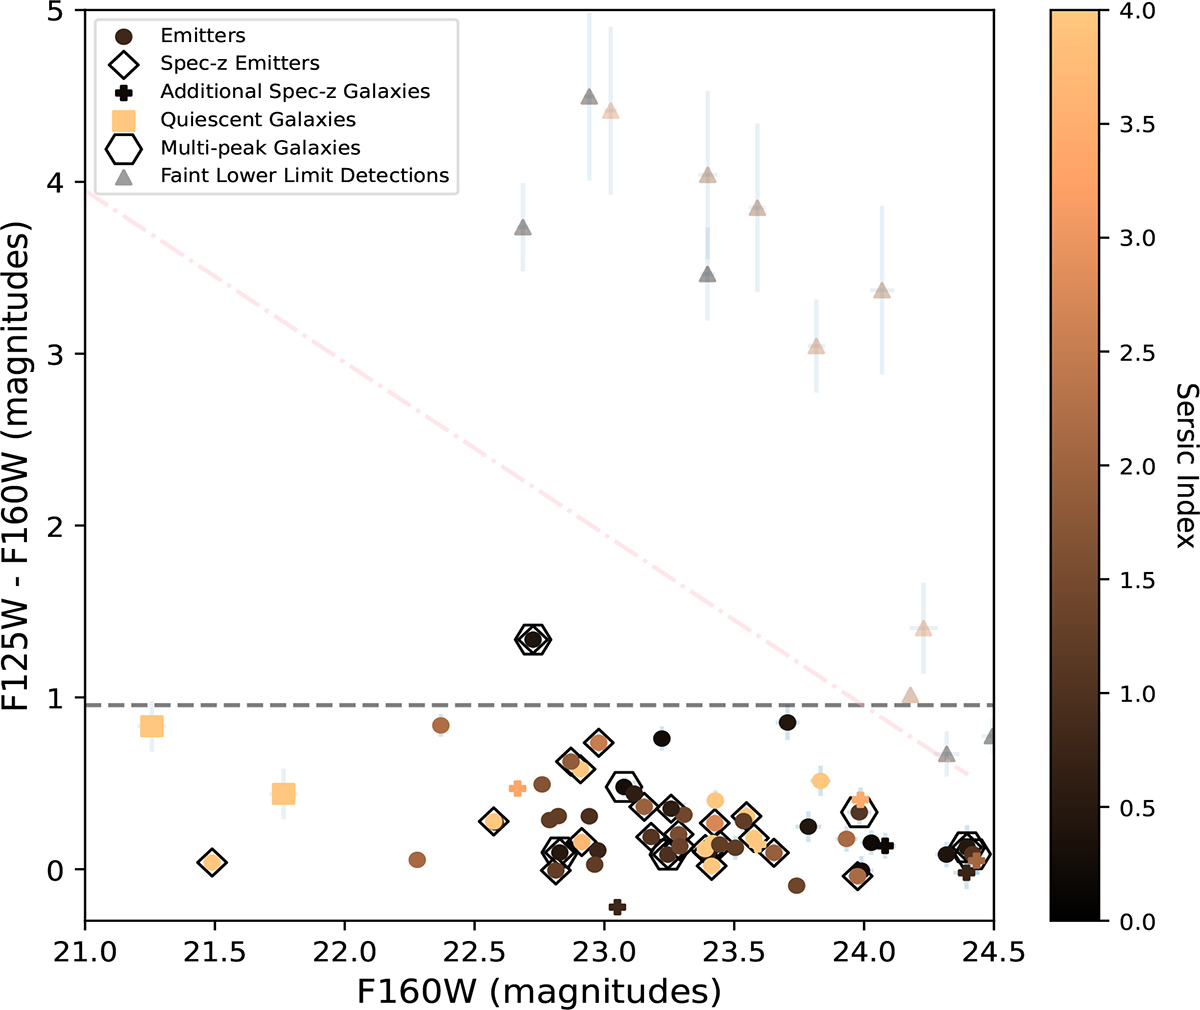
Fig. D.1.
Download original image
Color-magnitude diagram for BOSS1244 including the lower limit detections. The legend is identical to Fig. 8, except we included a subset of galaxies detected in F160W, but not detected above our magnitude limit in F125W. We have included an estimate of their color shown in upward pointing triangles. As in Fig. 8, the pink dot-dashed line marks our detection limit relative to the galaxies below our detection limit in F125W.
Current usage metrics show cumulative count of Article Views (full-text article views including HTML views, PDF and ePub downloads, according to the available data) and Abstracts Views on Vision4Press platform.
Data correspond to usage on the plateform after 2015. The current usage metrics is available 48-96 hours after online publication and is updated daily on week days.
Initial download of the metrics may take a while.