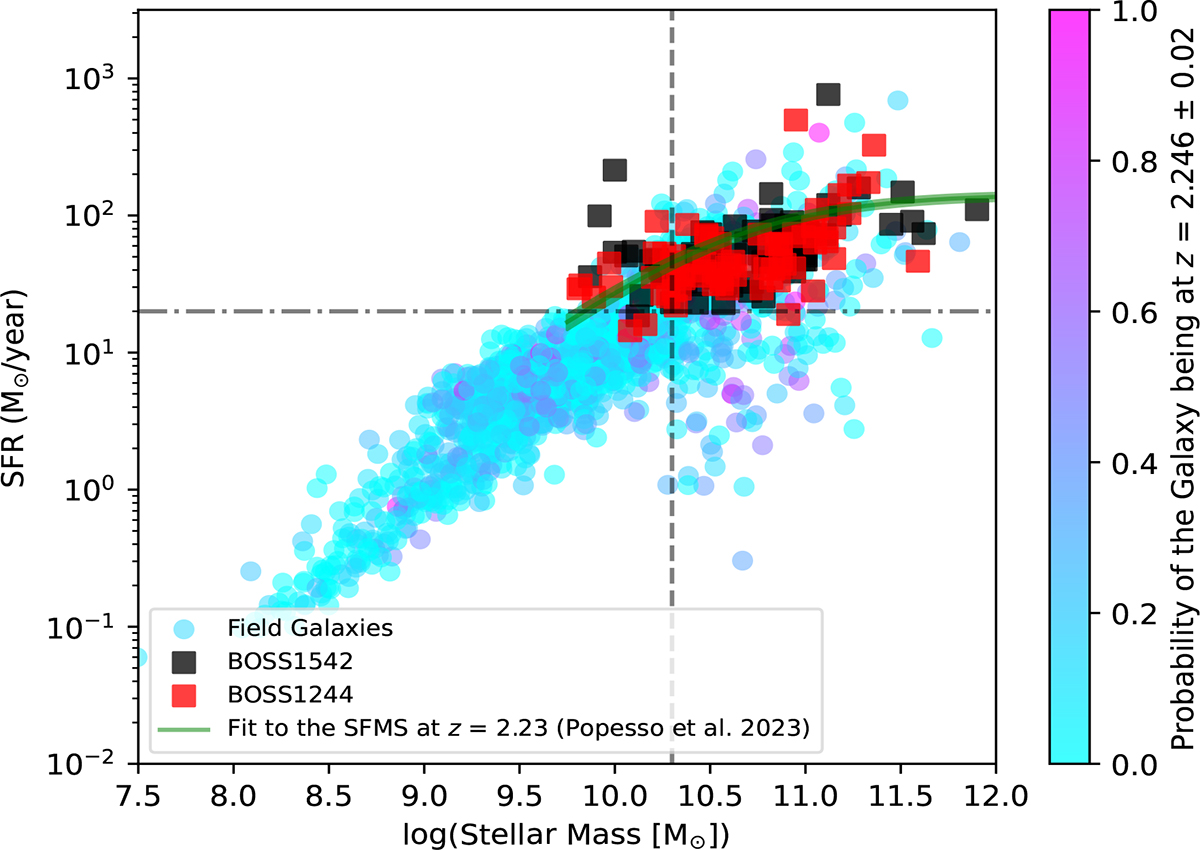
Fig. 4.
Download original image
Star formation rate as a function of stellar mass for our samples of HAEs from BOSS1244 and BOSS1542 overplotted on the coeval sample of field galaxies with SFRs and stellar masses from Osborne & Salim (2024) in the CANDELS fields. The color of the coeval field sample galaxy represents the likelihood that a given galaxy is at z = 2.246 ± 0.02 based on the photometric redshifts from Kodra et al. (2023). We overplotted an estimate of the star formation main sequence at z = 2.23 based on the analysis in Popesso et al. (2023) in green. Because the star formation main sequence is calibrated using a Kroupa IMF, we converted the star formation rates and stellar masses to reflect the Chabrier IMF used in Osborne & Salim (2024). Although we measured the likelihood that all galaxies, regardless of the median redshift estimate are at z = 2.246, in the above plot, we only included those galaxies with a median photometric redshift (or spectroscopic redshift) of 2 < z < 3. The vertical line represents the 90% stellar mass completeness limit for BOSS1244 and BOSS1542 (1010.3 M⊙) based on the analysis in Liu et al. (2023). The horizontal line shows our estimate of the SFR completeness limit (20 M⊙/yr).
Current usage metrics show cumulative count of Article Views (full-text article views including HTML views, PDF and ePub downloads, according to the available data) and Abstracts Views on Vision4Press platform.
Data correspond to usage on the plateform after 2015. The current usage metrics is available 48-96 hours after online publication and is updated daily on week days.
Initial download of the metrics may take a while.