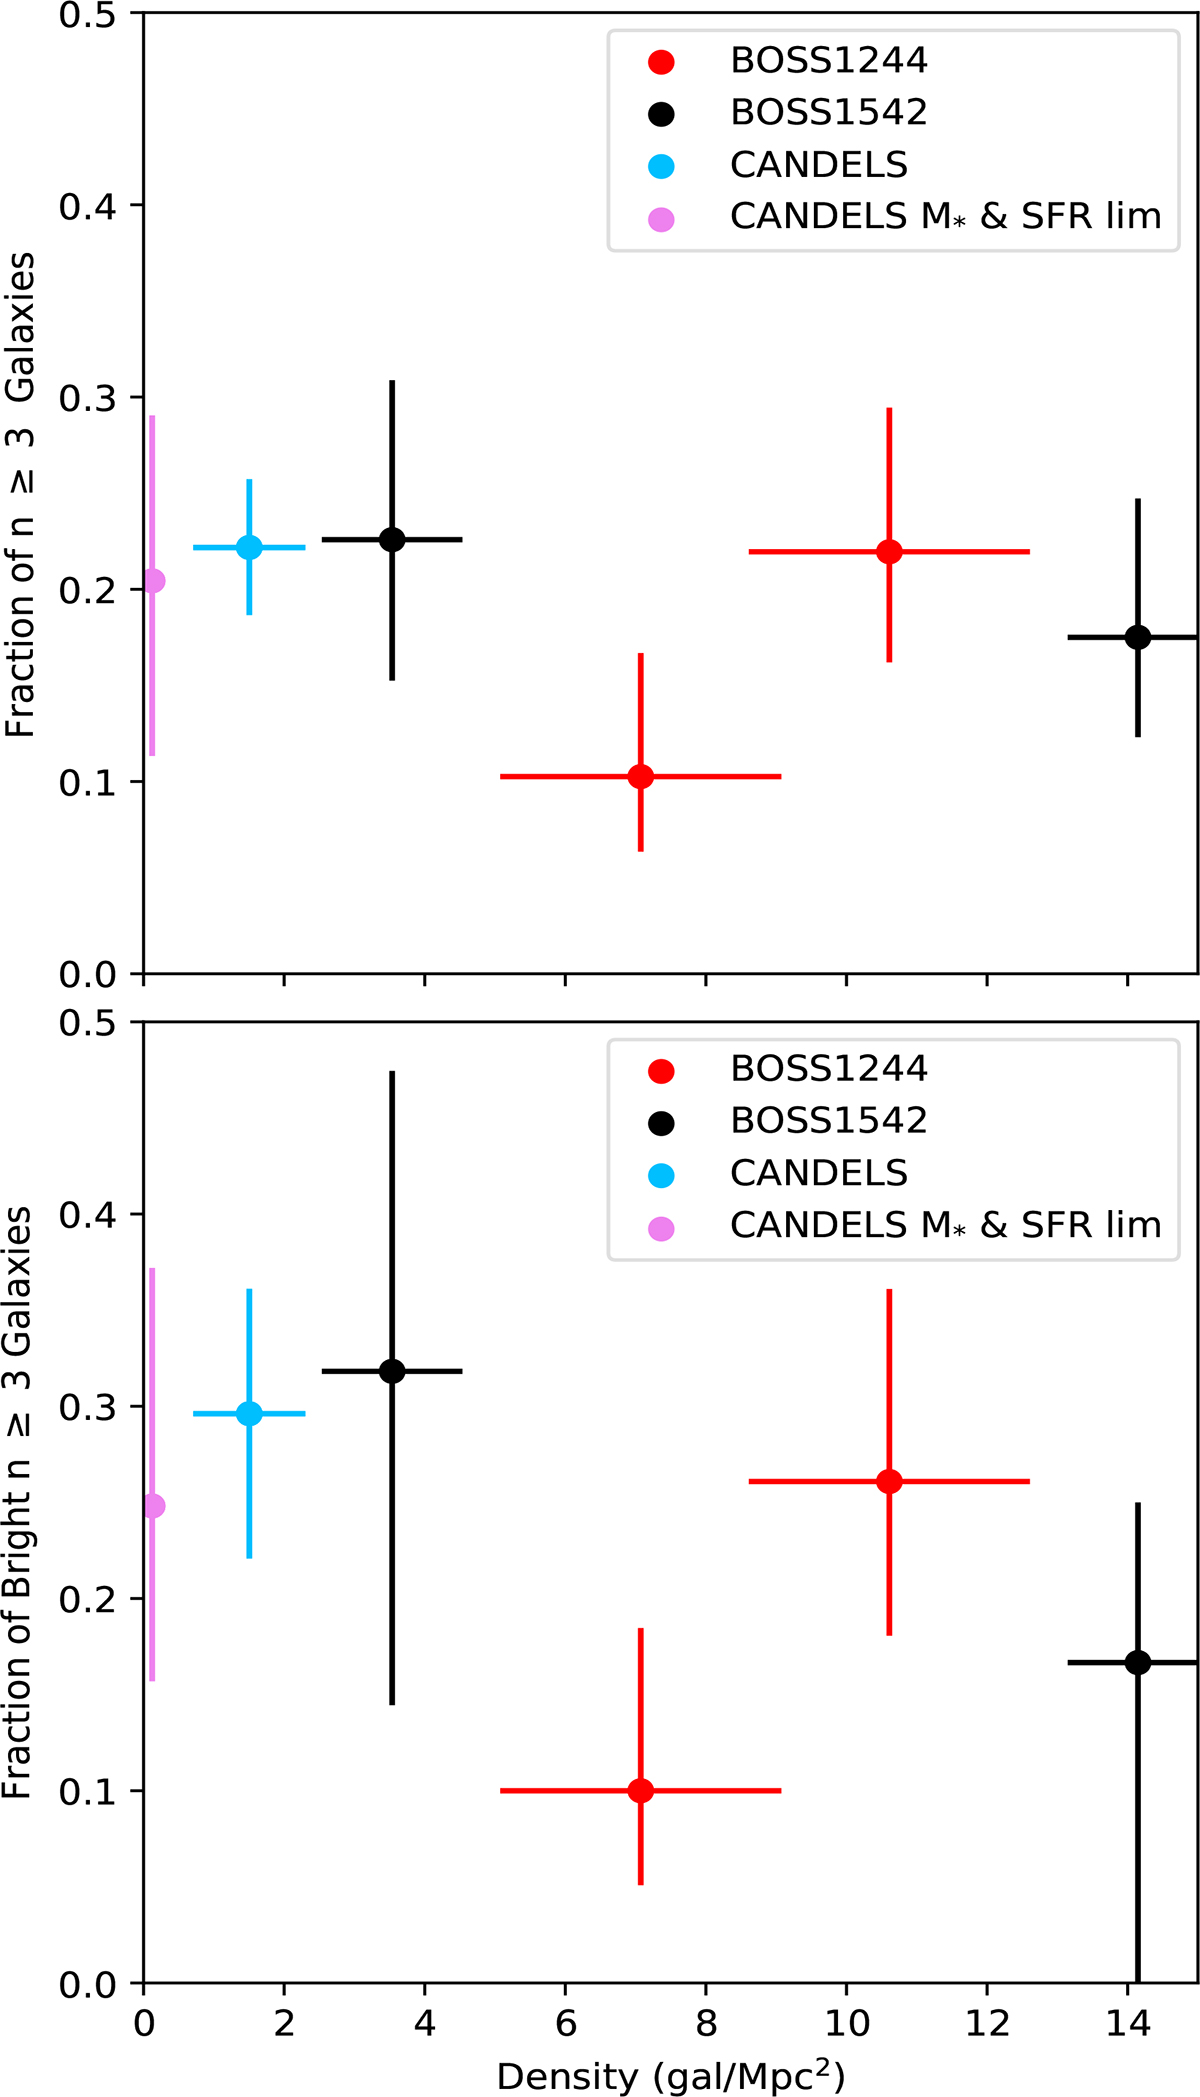
Fig. 6.
Download original image
Morphology-density relation in BOSS1244 and BOSS1542 for strongly bulge-dominated galaxies (n ≥ 3). The same legend is used as in Fig. 5. Top: All detected galaxies brighter than our magnitude limit (mF160W < 24.5). Bottom: All detected galaxies brighter than an m*+1 galaxy at z = 2.246. In each plot, the density measurement is for the entire sample. As in Fig. 5, the value of the fraction of galaxies with n ≥ 3 for each sample is measured by bootstrapping over the measured errors in Sérsic index over 1000 iterations. Here, we see a local morphology-density relation in BOSS1244, but no such relation in BOSS1542, pointing to differences in the evolutionary states of these protoclusters.
Current usage metrics show cumulative count of Article Views (full-text article views including HTML views, PDF and ePub downloads, according to the available data) and Abstracts Views on Vision4Press platform.
Data correspond to usage on the plateform after 2015. The current usage metrics is available 48-96 hours after online publication and is updated daily on week days.
Initial download of the metrics may take a while.