Open Access
Fig. 7.
Download original image
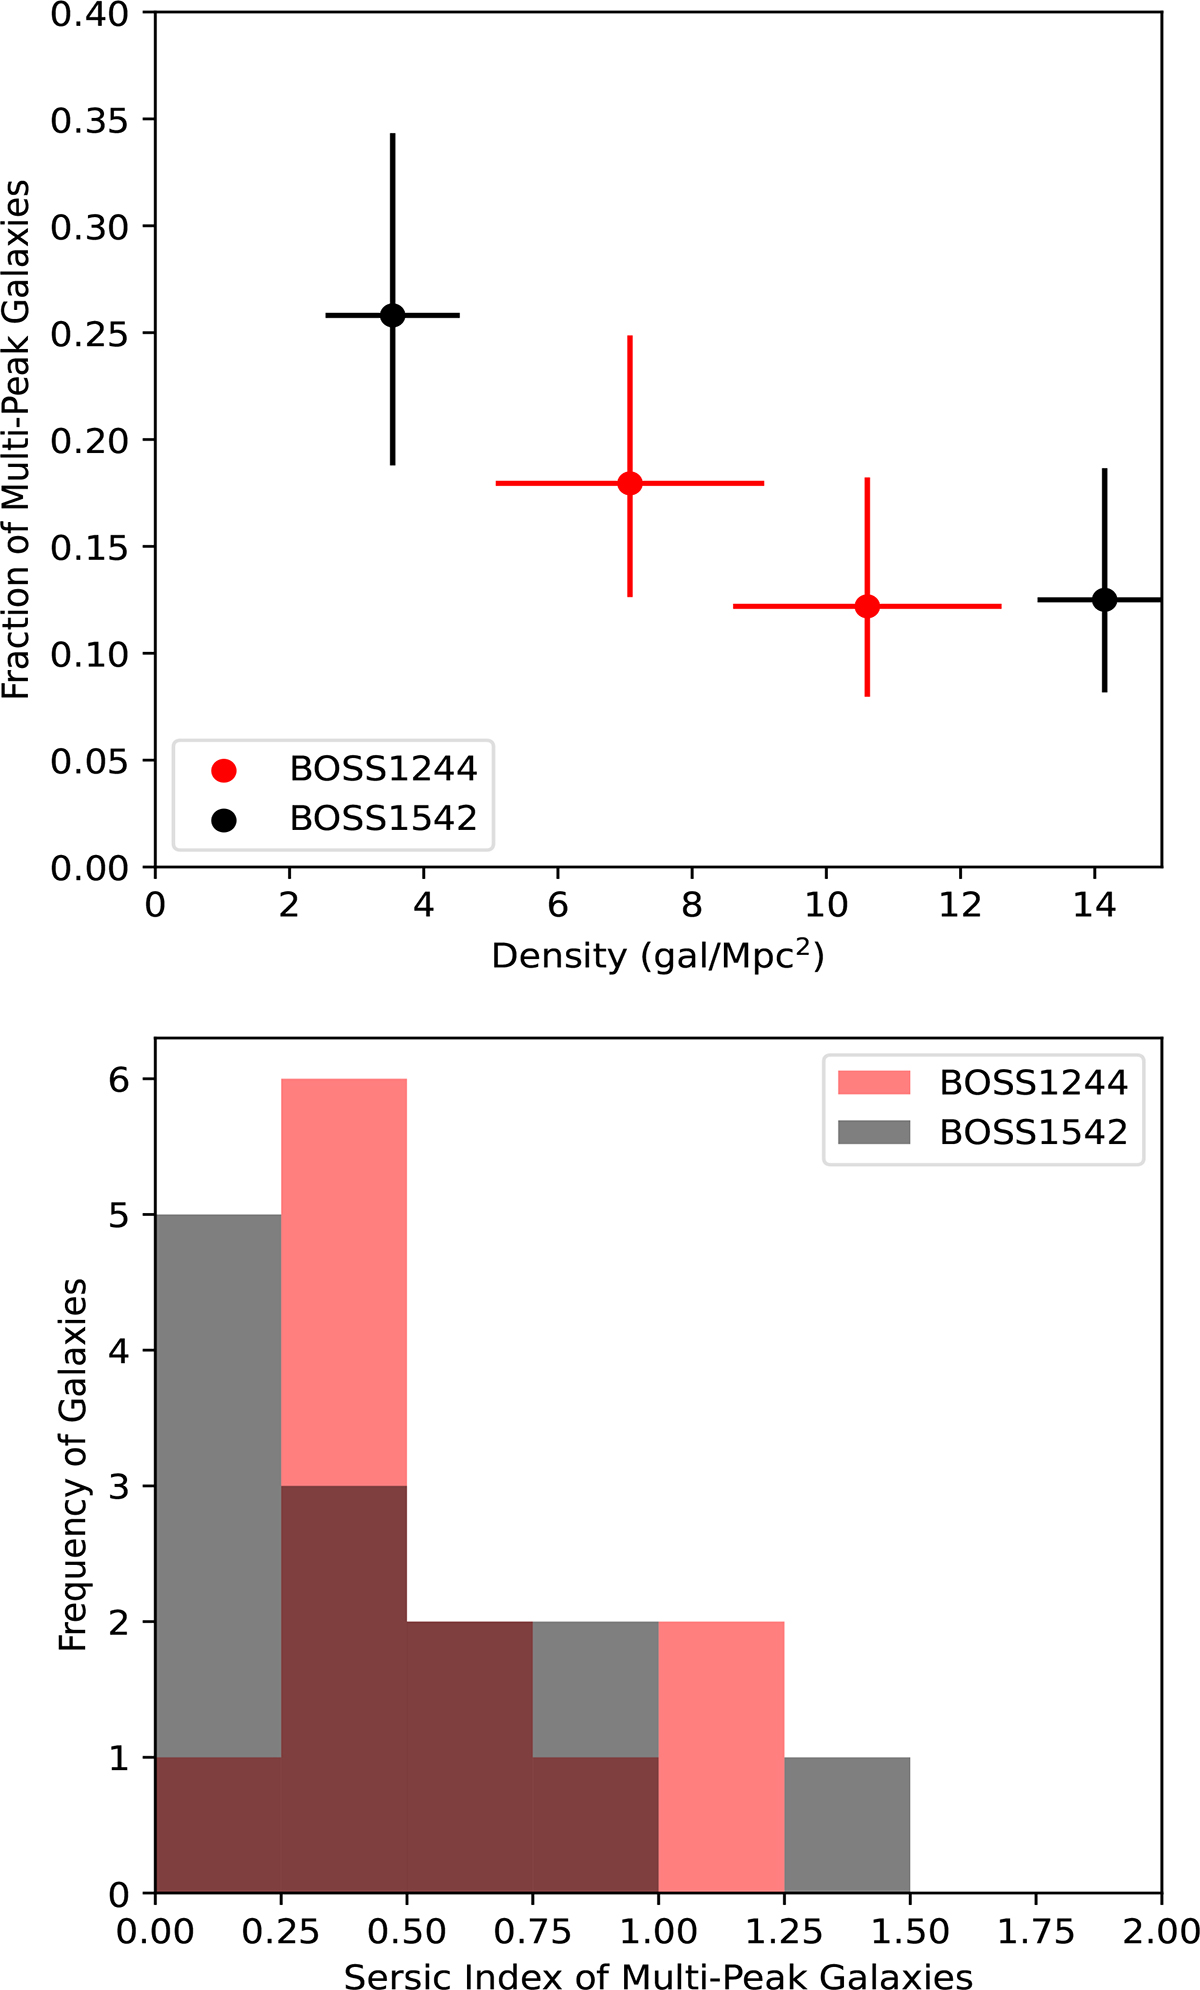
Top: Merger-density relation for the multi-peak galaxies in two MAMMOTH protoclusters. Bottom: Histogram of the Sérsic indices of multi-peak galaxies. As previously noted, BOSS1244 is shown in red and BOSS1542 is shown in black. The density measurements are identical to those found in Figs. 5 and 6.
Current usage metrics show cumulative count of Article Views (full-text article views including HTML views, PDF and ePub downloads, according to the available data) and Abstracts Views on Vision4Press platform.
Data correspond to usage on the plateform after 2015. The current usage metrics is available 48-96 hours after online publication and is updated daily on week days.
Initial download of the metrics may take a while.