Fig. 8.
Download original image
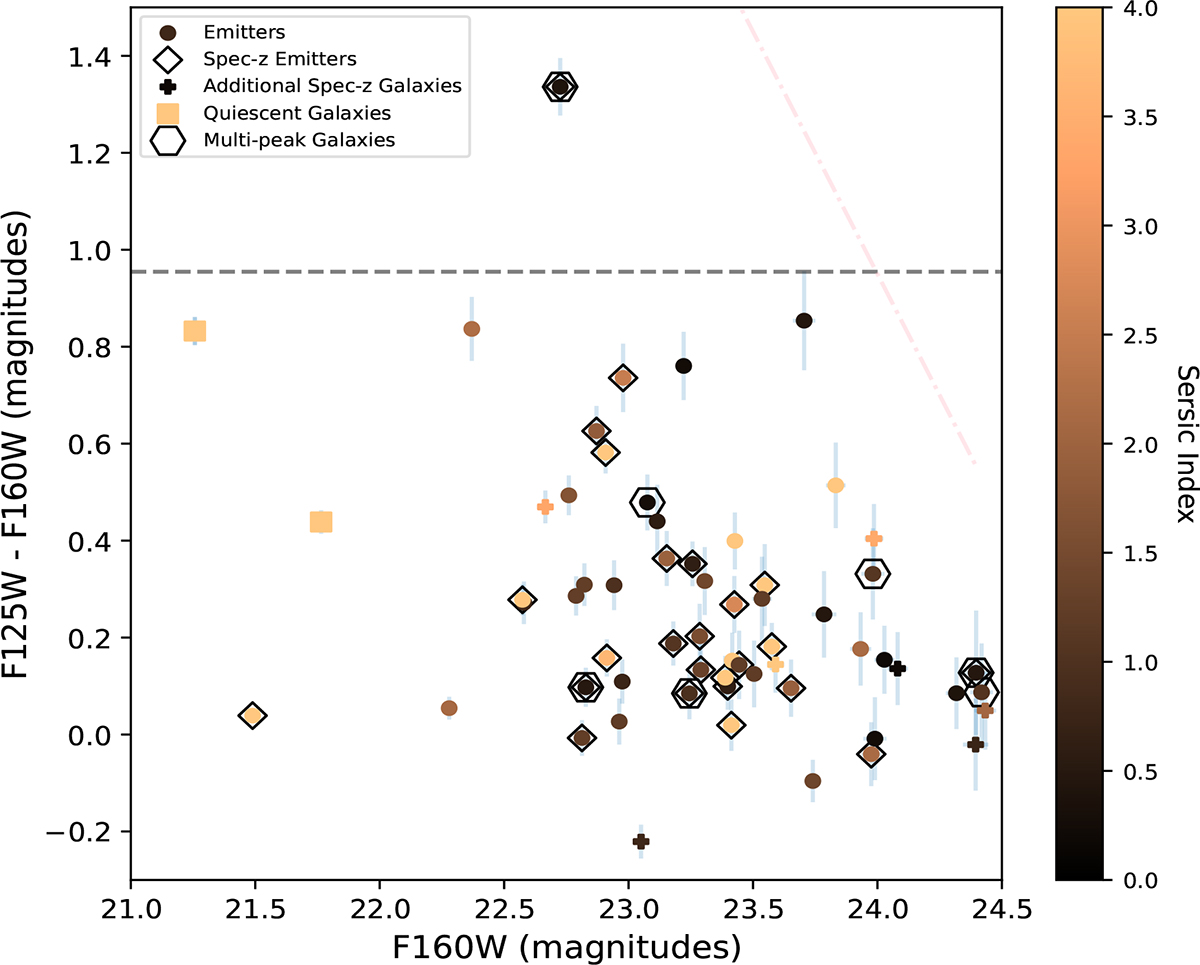
Color-magnitude diagram for BOSS1244. The HAEs are shown in circles. The spectroscopically-confirmed HAEs have a diamond surrounding them. The multi-peak galaxies have a hexagon surrounding them. The additional spectroscopic star-forming galaxies from HST grism are shown by a plus sign. The quiescent galaxies are shown in squares. The horizontal dashed line shows the color of a modeled red sequence galaxy based on EzGal models (Mancone & Gonzalez 2012) for a galaxy at z = 2.246. The pink dot-dashed line shows the magnitude limit for our analysis. The color of each point is based on the Sérsic index; late-type galaxies are darker and early-type galaxies are more orange.
Current usage metrics show cumulative count of Article Views (full-text article views including HTML views, PDF and ePub downloads, according to the available data) and Abstracts Views on Vision4Press platform.
Data correspond to usage on the plateform after 2015. The current usage metrics is available 48-96 hours after online publication and is updated daily on week days.
Initial download of the metrics may take a while.